
Most traders assume that finding the right single indicator is the key to consistent profits. That belief costs them money. Understanding how trading indicators generate profits requires a different framework entirely: one built on confirmation, complementary signals, and disciplined risk management. The data shows that multi-indicator systems don't just slightly outperform single-indicator approaches. They outperform them significantly, and the gap between traders who know this and those who don't explains a lot about why most retail accounts underperform year after year.
Table of Contents
- Key takeaways
- How trading indicators generate profits: the core mechanics
- Why combining indicators changes the profit equation
- Common pitfalls when applying indicators for profit
- Building an effective indicator strategy step by step
- My honest take on indicators and trading profits
- Take your indicator strategy further with Quantlogicx
- FAQ
Key takeaways
| Point | Details |
|---|---|
| Single indicators underperform | Single-indicator strategies succeed only 35-42% of the time in ranging markets. |
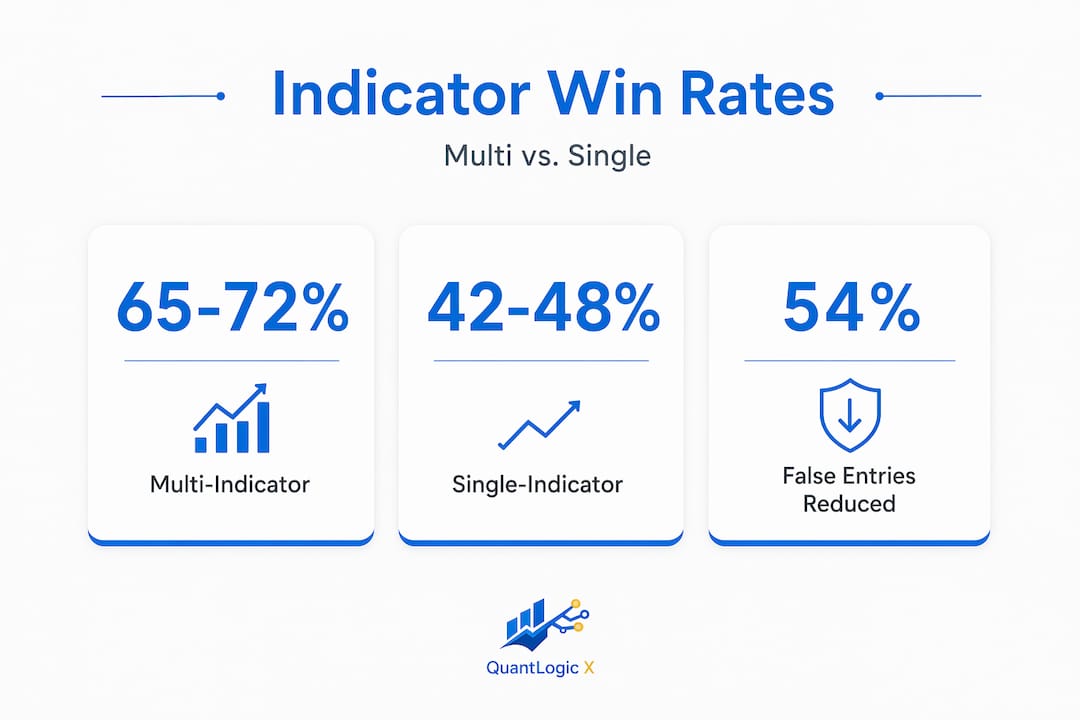
| Combinations raise win rates | Using 3-4 complementary indicators together pushes win rates above 65-72% consistently. |
| Volume confirms real moves | Breakouts with strong volume confirmation succeed 73% of the time versus 39% for low-volume setups. |
| Risk management beats prediction | Dynamic ATR-based stop-losses protect capital better than searching for a perfect entry signal. |
| Backtesting is non-negotiable | Validating your indicator stack through backtesting separates profitable strategies from theory. |
How trading indicators generate profits: the core mechanics
Trading indicators are mathematical formulas applied to price, volume, and time data. They don't predict the future. What they do is compress raw market data into readable signals that help you identify probable conditions, and probability is what profits are built on.
There are four main indicator categories, and each serves a distinct function:
- Trend indicators (Moving Averages, MACD) reveal direction and momentum of a prevailing move. The 200 EMA, for example, tells you whether price is broadly above or below long-term equilibrium.
- Momentum oscillators (RSI, Stochastic) measure the speed and relative strength of price movement. They signal when an asset is overbought or oversold within its current trend.
- Volume indicators (OBV, Volume bars) show whether price moves have market participation behind them. A breakout without volume is often a trap.
- Volatility indicators (Bollinger Bands, ATR) measure how much price is moving relative to recent history. These are especially useful for setting stop-losses that adapt to current conditions.
Understanding indicator type and function is the prerequisite for using them profitably. A trader who applies an RSI in a strongly trending market without a trend filter is fighting the wrong battle with the wrong tool. No single best indicator exists. Effectiveness depends on asset class, market type, and your trading style. That nuance matters before you place a single trade.
Why combining indicators changes the profit equation
Here is where most traders leave real money on the table. They find one indicator they trust, apply it across all conditions, and wonder why it stops working.
Multi-indicator systems requiring 3+ confirmations achieve 65-72% win rates compared to 42-48% for single-indicator approaches. That is not a marginal improvement. It represents a structural shift in your trading edge. And a 43% improvement in risk-adjusted returns is the kind of number that compounds dramatically over time.
The mechanism behind this improvement is confirmation. When your trend filter, momentum oscillator, and volume indicator all agree, the probability of a false signal drops sharply. When they disagree, you simply don't trade. That discipline alone separates consistent traders from reactive ones.

Consider this example combination used by many structured traders:
| Layer | Indicator | Function |
|---|---|---|
| Trend filter | 200 EMA + MACD | Confirm overall direction and trend momentum |
| Entry timing | RSI + Stochastic | Identify overbought/oversold conditions for precise entry |
| Confirmation | Volume / OBV | Verify that real market participation exists behind the signal |
Combining RSI and Stochastic reduces false breakout entries by 54% compared to RSI alone. That single refinement, adding one confirming oscillator, materially changes your trade outcomes. And when you layer volume on top, breakouts meeting strict volume and RSI criteria succeed 78% of the time, compared to 32% for less-confirmed breakouts.
Pro Tip: Don't add indicators to feel busy. Add them to answer specific questions: What is the trend? Is momentum aligned? Is volume confirming? If an indicator doesn't answer one of those three questions clearly, remove it.
There is, however, a ceiling on this logic. Using more than 6 indicators decreases decision speed by 47% and reduces optimal entry frequency by 34%. More isn't better past a certain point. The goal is a lean, well-defined confirmation stack, not a chart covered in colored lines.
Common pitfalls when applying indicators for profit
The biggest trap isn't using the wrong indicator. It's treating any indicator as a predictive tool rather than a descriptive one. Indicators are descriptive risk filters, not magic lines. They tell you what the market has done and what conditions currently exist. Trading profitably means using that information to take high-probability positions with defined risk, not to predict the next move with certainty.
Here are the most common mistakes traders make when building indicator-based strategies:
- Ignoring market regime. A moving average crossover works well in a trending market and fails badly in a ranging one. Always identify whether the market is trending or consolidating before applying trend-based signals.
- Skipping volume confirmation. Price action without volume is a rumor. Volume with price action is a fact. Always check whether the move has real participation behind it.
- Avoiding backtesting. Backtesting is the benchmark tool for assessing strategy viability under realistic conditions, including transaction costs and slippage. Skipping it means you're trading theory, not a proven system.
- Setting fixed stop-losses. ATR-tied stop-losses scale with volatility, which means they adjust automatically when conditions get choppy. Fixed stops get eaten alive during volatile periods.
- Overloading charts. Every additional indicator past your core four adds noise. Analysis paralysis is a real performance drain.
Pro Tip: Before adding any new indicator to your setup, ask yourself what question it answers that your existing stack doesn't. If the answer is vague, don't add it.
Professional traders use indicators primarily as filters for risk management rather than standalone predictors. They only execute trades when trend, momentum, and volume all align. That discipline is the real edge, not the specific indicators they choose.
Building an effective indicator strategy step by step
Knowing the theory is one thing. Actually building a trading system that generates profits from trading signals is another. Here is a practical, structured approach to doing it right.
- Start with a clean chart. Before layering indicators, study raw price action on the asset you're trading. Understand support, resistance, and recent behavior. Indicators should enhance your reading of price, not replace it.
- Choose your trend filter. The 200 EMA is a reliable baseline for most markets. On shorter timeframes, a 50 EMA or MACD histogram works well for directional bias.
- Add a momentum oscillator. RSI (14) is a solid default. Pairing it with Stochastic gives you a second momentum read and that combination cuts false entries significantly.
- Layer in volume confirmation. OBV (On Balance Volume) or simple volume bars help you immediately identify whether a signal has real market participation or is just noise.
- Define your entry and exit rules clearly. Write them down. For example: only enter long when price is above the 200 EMA, MACD is positive, RSI is rising from below 50, and volume is above its 20-period average.
- Backtest with realistic conditions. Use historical data across at least two market regimes (trending and ranging). Account for spreads and commissions. AI-assisted backtesting tools have made this process significantly faster for individual traders.
- Apply multi-timeframe confirmation. Multi-timeframe confirmation raises win rates by 28%. If your trade setup looks good on the 15-minute chart but the 1-hour chart is bearish, the 15-minute setup is fighting the tide.
- Track and refine. Keep a trading log. Review which setups from your indicator stack are working and which aren't every two to four weeks.
"The market isn't there to validate your indicators. Your indicator stack is there to help you read the market. That direction matters." — From the QuantLogicX community journal
The whole framework relies on iterative refinement. You build it, test it, trade it with small size, and refine it. The traders who learn how to use trading indicators profitably are not the ones who find the perfect setup once. They are the ones who build a repeatable process and improve it over time.
For those exploring crypto-specific applications, this guide to crypto indicator setups breaks down how to adapt these frameworks to higher-volatility digital assets where confirmation becomes even more critical.
My honest take on indicators and trading profits
I've watched traders blow accounts on single-indicator strategies that looked compelling on paper. And I've watched the same traders turn their results around not by finding a better indicator, but by adding one layer of confirmation and defining their exits properly.
From my experience, the biggest misconception is that more sophisticated indicators produce better results. They don't. Simplicity and confirmation do. I've consistently found that a 200 EMA, an RSI, and volume bars tell you almost everything you need to know about whether a trade is worth taking.
The uncomfortable truth is that profitability comes more from disciplined risk management than from perfect signal generation. Downside protection through volatility-based stops is often more impactful than attempting to nail the ideal entry. I've tested this repeatedly. The traders I've seen succeed long-term are almost always better at cutting losses fast than they are at picking tops and bottoms.
I use indicators as filters, not forecasts. If my stack doesn't agree, I don't trade. That patience is harder to develop than any technical skill, and it matters more than knowing the difference between MACD and OBV.
— Tran
Take your indicator strategy further with Quantlogicx
If you've built the foundation described above and you're ready to put it into practice with a tool that handles the multi-indicator confirmation layer for you, Quantlogicx offers exactly that.
The Quantlogicx Long & Short TradingView indicator integrates trend, momentum, and volume confirmations into a single, zero-repaint signal. No repainting means the signal you see at bar closure is the signal that executed. No guessing, no retroactive adjustments. The algorithm carries an 81% win rate across stocks, forex, and crypto, and over 2,000 traders have deployed it across live accounts. For traders who want clean, confirmed buy/sell signals for 2026 without rebuilding their indicator stack from scratch, this is the practical next step. Explore the platform, review the signal documentation, and see how confirmed entries perform across real market conditions.
FAQ
What is the main way trading indicators generate profits?
Indicators generate profits by filtering high-probability trade setups from market noise. When multiple indicators align on the same signal, the probability of a successful trade increases significantly compared to relying on a single indicator.
How many indicators should you use in a trading strategy?
Research shows that 3-4 complementary indicators produce the best results. Using more than 6 decreases decision speed and increases the risk of conflicting signals that lead to missed opportunities.
Why do single-indicator strategies fail in ranging markets?
Single-indicator strategies succeed only 35-42% of the time in ranging markets because most trend-based indicators generate false signals when price moves sideways without directional momentum.
How does backtesting improve indicator-based trading?
Backtesting lets you measure win rate, risk-reward ratio, and drawdown across historical data before risking real capital. It also helps identify whether your strategy works across both trending and ranging market conditions.
What role does volume play in confirming trading signals?
Volume acts as a participation filter. Breakouts confirmed by above-average volume succeed 73% of the time, compared to 39% for breakouts without volume confirmation. It separates genuine moves from weak, low-conviction price action.