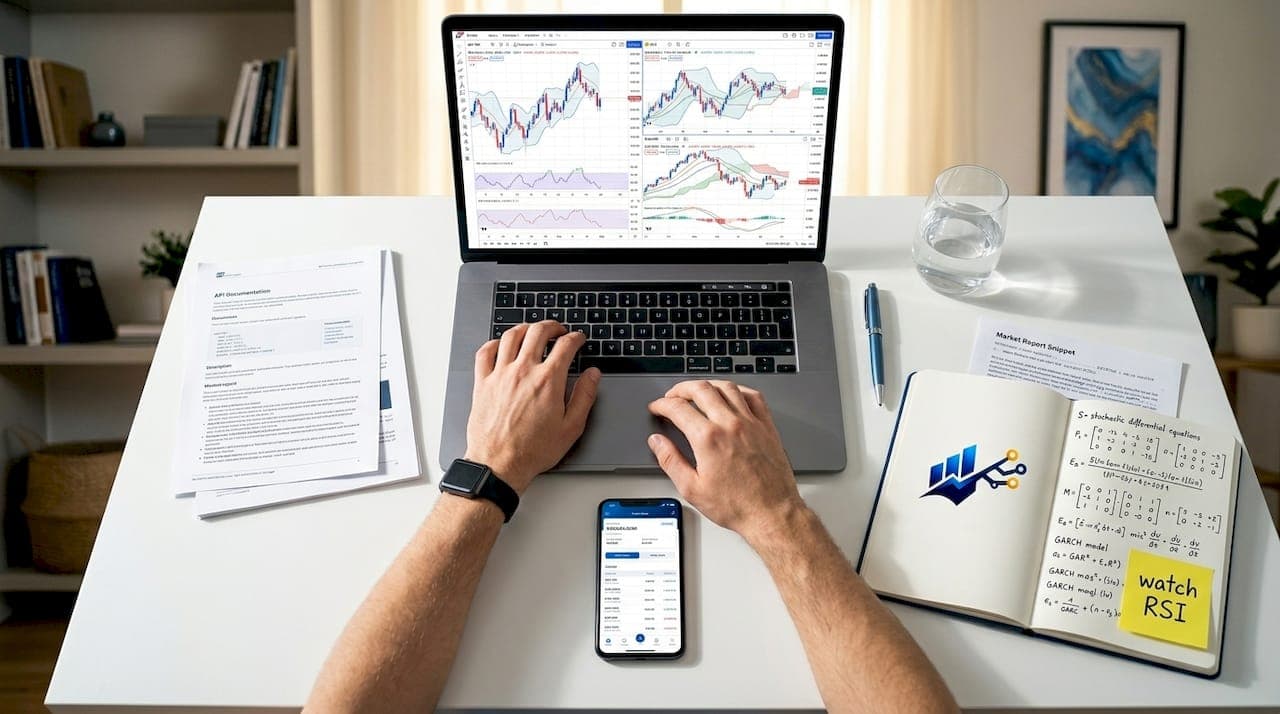
Most traders discover signals and assume the hard work is over. A green arrow pops up, they buy, and they wait for the money to arrive. That is exactly the mindset that burns accounts. Learning how to read trading signals basics means understanding what a signal actually contains, where it comes from, and whether the conditions support acting on it. No signal service can guarantee profits. What separates winning traders from losing ones is knowing how to interpret and validate what they see before they place a single trade.
Table of Contents
- Key takeaways
- How to read trading signals basics: the 6 core components
- Types of trading signals and what they reveal
- How to validate signals using confluence and context
- Risk management fundamentals for signal-based trading
- Practical steps to implement signals in your trading routine
- My honest take on signal dependency
- How Quantlogicx helps you read and act on signals faster
- FAQ
Key takeaways
| Point | Details |
|---|---|
| Signals need validation | Never act on a signal in isolation. Always confirm with context, trend, and risk parameters. |
| Six core components matter | A complete signal includes asset, direction, entry, stop-loss, take-profit, and rationale. |
| Signal types serve different purposes | Technical, fundamental, sentiment, and quantitative signals each give a different edge depending on market conditions. |
| Confluence improves win rates | Two or more aligning indicators create significantly higher-probability setups than any single signal. |
| Risk management is non-negotiable | Proper position sizing and a reward-to-risk ratio of at least 1.5R keeps losses manageable even on losing trades. |
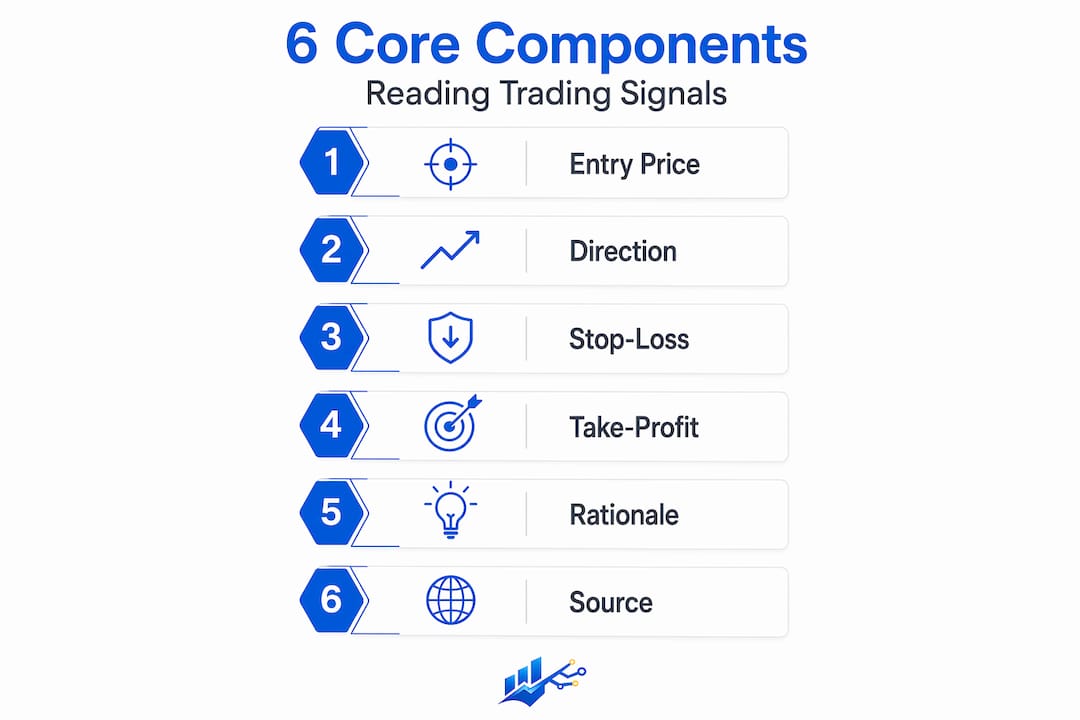
How to read trading signals basics: the 6 core components
Before you can analyze any signal, you need to know what a complete one actually looks like. A lot of signal providers send out half-finished information, and beginners accept it without question. A complete trading signal must contain six core components: the asset being traded, the direction (long or short), the entry price or range, a stop-loss level, at least one take-profit target, and the rationale or trigger behind the call.
Here is what each component does for you:
- Asset: Tells you which market to trade. Specific matters. "Crypto" is not an asset. "BTC/USD" is.
- Direction: Long means you expect the price to rise. Short means you expect it to fall. Never assume.
- Entry price or range: A precise level or a small zone where the trade makes sense. Chasing a signal 2% beyond the entry invalidates the entire setup.
- Stop-loss: The price where you exit if the market moves against you. No stop-loss means no defined risk.
- Take-profit target: The price where you lock in gains. Without this, you are guessing when to exit.
- Rationale or trigger: The "why." A moving average crossover, an RSI reading, a support bounce. This tells you whether the logic fits current conditions.
Signals missing a stop-loss or take-profit are incomplete by definition. Providers who omit these components are pushing responsibility onto you without giving you the tools to manage it. Treat those signals as unusable until the full picture is provided.
Pro Tip: When reviewing any signal, cover the provider's recommendation and reconstruct the rationale yourself from the trigger. If you cannot do that, you do not yet understand the signal well enough to trade it.
Types of trading signals and what they reveal
Understanding trading signals also means knowing the source. Not all signals come from the same place, and each type carries different strengths and blind spots. Broadly, signals fall into four categories.
| Signal type | Primary source | Strength | Weakness |
|---|---|---|---|
| Technical | Price action, indicators | Precise entry/exit levels | Lagging in fast-moving markets |
| Fundamental | Economic data, earnings | Long-term directional edge | Poor timing on execution |
| Sentiment | Market psychology, positioning | Early warning of reversals | Hard to quantify consistently |
| Quantitative | Algorithms, statistical models | Removes emotional bias | Can fail outside tested conditions |
Technical signals are what most beginners see first. Tools like RSI, MACD, Bollinger Bands, and moving averages generate buy and sell conditions based on price history. RSI above 70 suggests overbought conditions. A MACD crossover signals a shift in momentum. These are reading trading indicators in their most direct form.
Fundamental signals come from economic reports, interest rate decisions, earnings releases, or geopolitical events. A stronger-than-expected jobs report can drive USD higher across all pairs within seconds. These signals tell you direction but rarely tell you when to enter with precision.
Sentiment signals track where traders and institutions are positioned. The COT (Commitment of Traders) report is one example. When retail traders are overwhelmingly long on an asset, smart money is often positioned the opposite way.
Quantitative signals come from algorithms and statistical models, including tools like the Quantlogicx indicator. These are designed to remove human bias from the equation. The edge here is consistency. The risk is over-fitting, where a model works beautifully on historical data and fails in live conditions.
Most profitable trades combine a fundamental reason with a confirming technical signal, which is why understanding all four types makes you a more complete reader of the market.
How to validate signals using confluence and context
Reading a signal is one thing. Deciding whether to act on it is another skill entirely. This is where confluence comes in. Confluence simply means that multiple independent factors are pointing in the same direction at the same time. When your RSI is oversold, price is sitting at a major support level, and the higher timeframe trend is bullish, that is confluence. Each factor alone is just a hint. Together, they form a case.
Experienced traders validate signals against higher timeframe structure, the absence of conflicting news, momentum confirmation, and current market volatility. This is not a complicated process. It becomes a quick mental checklist before every trade.
Here is a practical step-by-step process for verifying a sample signal:
- Identify the signal components. Check all six components are present. If anything is missing, pause.
- Check the higher timeframe trend. A long signal on the 15-minute chart against a strong downtrend on the 4-hour chart is fighting the market. Know which direction the market respects.
- Look for supporting levels. Is the entry near a key support or resistance zone? Price bouncing from confirmed support adds weight to a long signal.
- Confirm momentum. Is RSI pointing in the same direction? Is volume expanding on the move? Momentum confirmation is one of the most useful filters beginners overlook.
- Check the news calendar. High-impact news events like Fed announcements or non-farm payrolls can invalidate technical setups instantly. Do not enter a position 30 minutes before major data.
- Assess the reward-to-risk. If your stop is large and the take-profit is small, the math does not support the trade even if the signal looks good.
Traders who combine multiple independent signals consistently outperform those relying on a single indicator. The goal is not to find more signals. It is to find fewer, better ones.
Pro Tip: Build a confluence checklist as a simple text note on your desktop. Before every trade, check off each item. If fewer than four of six criteria align, pass on the trade and wait.
Risk management fundamentals for signal-based trading
Here is the part most beginner trading signals guides skip: a great signal still loses without proper risk management. Understanding how to analyze trading signals means nothing if you blow 20% of your account on a single trade because the position size was wrong.

Proper position sizing typically means risking 0.5% to 1% of your account per trade. On a $5,000 account, that is $25 to $50 per trade. Small? Yes. Sustainable? Absolutely.
The math behind this is straightforward once you see it:
| Account size | Risk per trade (1%) | Stop-loss distance | Position size |
|---|---|---|---|
| $5,000 | $50 | 20 pips | $2.50 per pip |
| $10,000 | $100 | 50 pips | $2.00 per pip |
| $25,000 | $250 | 30 pips | $8.33 per pip |
Key principles to internalize:
- Place your stop-loss below a structural level (swing low for longs, swing high for shorts), not at a round number or arbitrary distance from entry.
- Target a reward-to-risk ratio of at least 1.5:1. If you risk $50, aim for at least $75 in profit. A 2:1 ratio means you can lose more than half your trades and still come out ahead.
- Reduce position size during high-volatility periods. When the market is erratic, your stop needs room to breathe, and your risk calculation must reflect that.
- Avoid common pitfalls like chasing alerts, trading without stops, and oversizing positions. These three behaviors account for more blown accounts than any other factor.
Successful signal use requires precise entry and exit rules aligned with a disciplined plan. The signal gives you the idea. Risk management determines whether the idea is worth acting on.
Practical steps to implement signals in your trading routine
Sourcing good signals and actually using them well are two different skills. Here is how to build a process that works for beginner and intermediate traders alike.
- Vet your signal provider. Evaluate providers on transparency, explanation quality, historical accuracy, and responsiveness. Any provider that cannot explain why a signal was generated should not have your trust or your money.
- Test on a demo account first. Backtesting and forward testing signals on demo accounts builds confidence and reveals weaknesses before real capital is at risk. Run at least 30 to 50 trades before going live.
- Add your own analysis. Do not copy signals blindly. Use them as a starting point, then run your confluence checklist. This turns you into a trader, not a signal follower.
- Journal every trade. Record the signal, your reasoning, entry, exit, and outcome. Over time, you will see patterns. You will notice which signals work in your chosen markets and which ones do not.
- Use TradingView-based tools for automation. Platforms like TradingView allow you to set alerts on indicator conditions, so you are notified when a setup meets your criteria. Explore scalping signal strategies for faster-moving markets once you have mastered the basics.
Pro Tip: After your first 30 journaled trades, calculate your actual win rate and average reward-to-risk ratio. Most traders are shocked by how different their real numbers are from their assumptions. This data is more valuable than any signal.
My honest take on signal dependency
I have worked with hundreds of traders at various skill levels, and the pattern I see most often is this: beginners find a signal service, get a few wins, and stop learning. They start treating signals like a salary. Then the market shifts, the signals stop working, and they have no independent skill to fall back on.
Signals should be educational tools, not shortcuts. The best traders I have observed use signals to confirm ideas they already hold, not to replace thinking. That mental shift changes everything. When I first started working through signal-based systems, I forced myself to write down my own trade thesis before looking at any alert. If the signal agreed with my read, I gave it serious consideration. If it contradicted my analysis, I used that as a learning moment rather than a trigger.
Signals are hypothesis inputs, not guaranteed outcomes. Treating them that way means you stay curious, you keep refining your method, and you never hand over your judgment to an algorithm. The market will always reward the trader who thinks.
— Tran
How Quantlogicx helps you read and act on signals faster
Once you understand signal basics, the next challenge is finding a tool that delivers clear, reliable signals without the noise. That is where Quantlogicx fits naturally into your workflow.
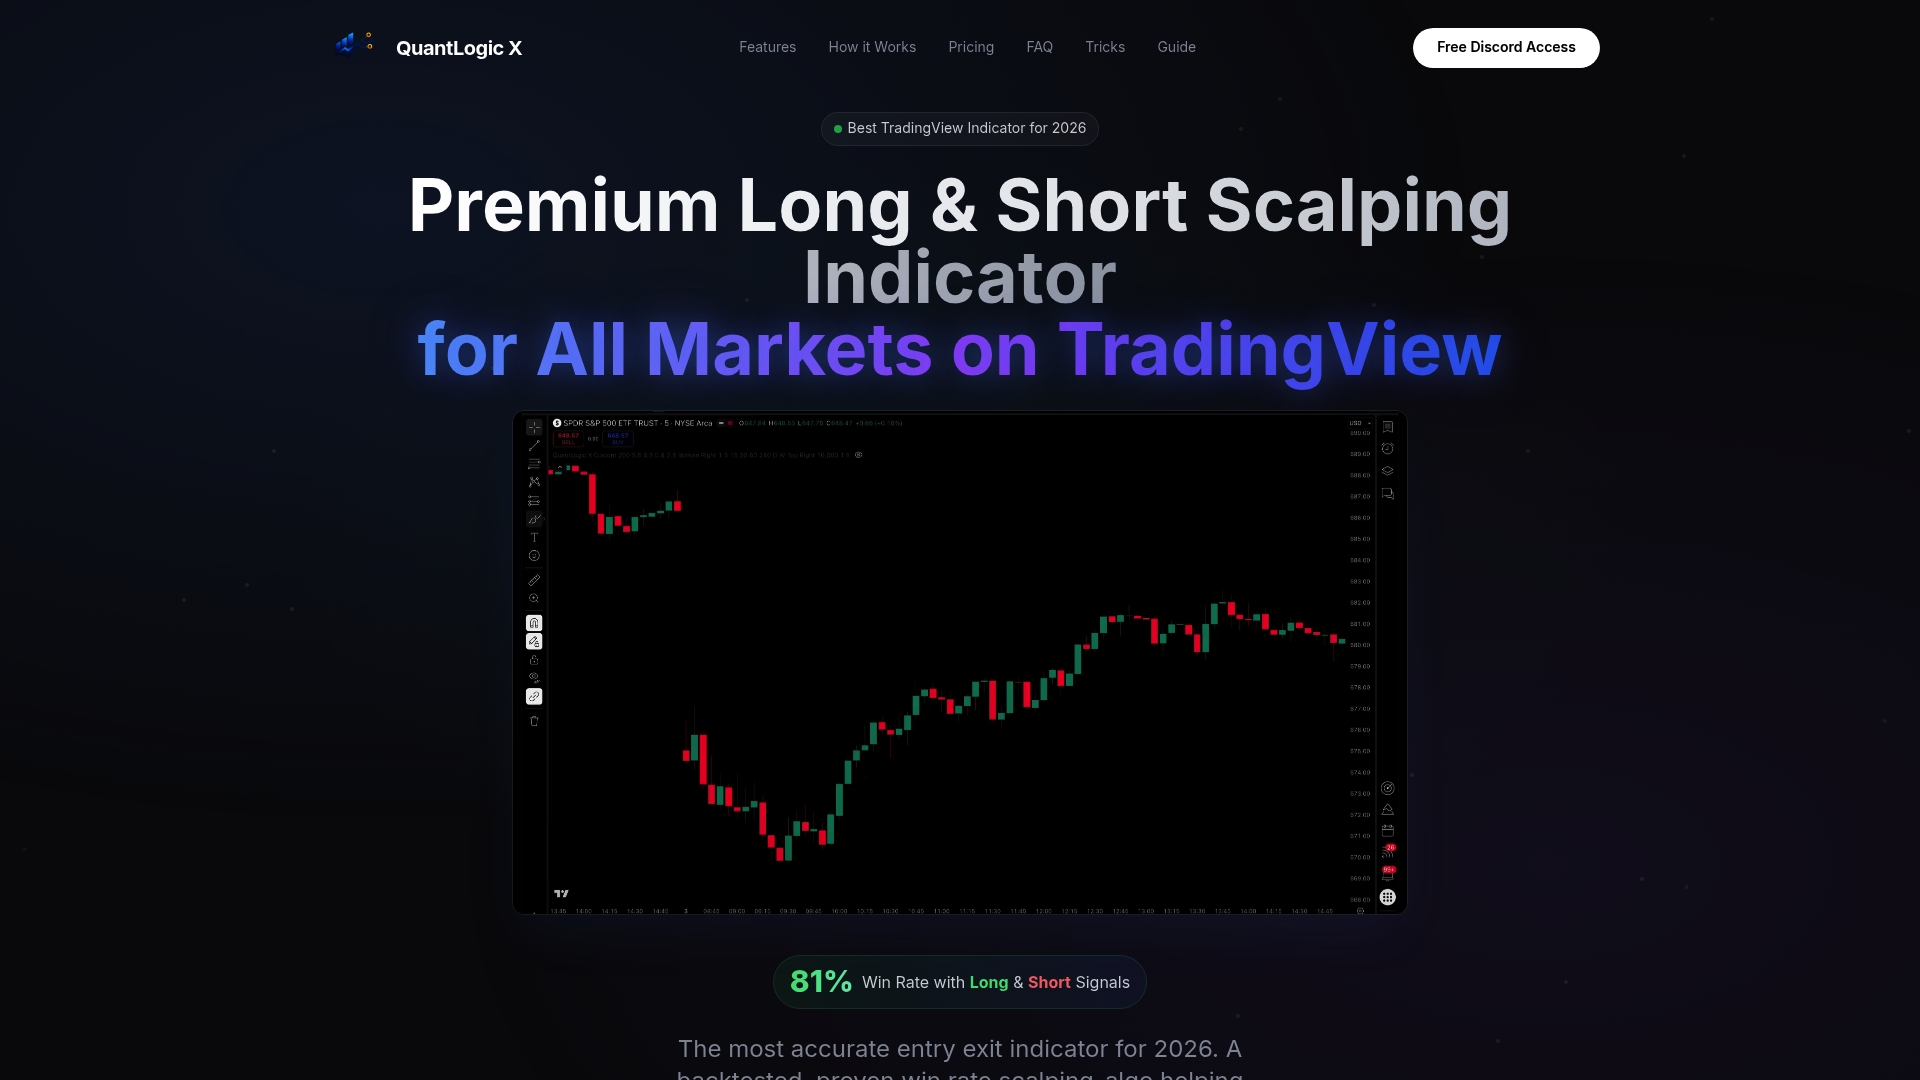
The Quantlogicx TradingView indicator is built on zero-repaint technology, which means the long and short signals you see at bar close do not change retroactively. What you see is what happened. With an 81% historical win rate across stocks, forex, and crypto, over 2,000 traders have used this tool to generate consistent entries without spending hours on manual analysis. For novice traders, it removes the guesswork on when to act. For intermediates, it serves as a clean confirmation layer on top of their existing process. Real-time alerts notify you the moment conditions align, so you never miss a setup. Explore the indicator's forex signal features to see how it fits your specific market.
FAQ
What is a trading signal in simple terms?
A trading signal is a trigger or recommendation to buy or sell an asset at a specific price, based on technical, fundamental, or algorithmic analysis. A complete signal includes an entry, stop-loss, take-profit, and the reason behind the call.
How do beginners start reading trading indicators?
Start by learning one indicator at a time, such as RSI or moving averages, and understand what market condition it measures. Apply it to a trading entry signal framework so you can connect the indicator reading to an actual trade decision.
What is signal confluence and why does it matter?
Confluence means two or more independent factors are pointing to the same trade direction simultaneously. It matters because multiple aligning indicators significantly increase the probability of a successful trade compared to acting on a single signal.
How much of my account should I risk on one signal?
Most professional traders risk between 0.5% and 1% of their account per trade. On a $10,000 account, that means no more than $100 at risk on any single position, regardless of how confident you feel about the signal.
Can trading signals guarantee profits?
No. No signal service can predict markets with 100% accuracy. The goal of using signals is to improve your decision-making process and manage risk effectively, not to find a guaranteed money-making system.