
Repainting indicators are defined as tools that retroactively alter their historical signals after new price data arrives, making past performance look far better than it ever was in real time. This is why repainting indicators mislead traders so consistently: the chart you analyze after the fact bears no resemblance to what the indicator showed when you needed to act. On platforms like TradingView, scripts built with Pine Script can silently repaint without any warning, and traders using these tools often discover the problem only after a string of unexpected live losses. Understanding the mechanics behind this behavior is the first step toward building a trading strategy you can actually trust.
Why repainting indicators mislead traders: the technical mechanics
The root cause of repainting is look-ahead bias, where an indicator incorporates data that was not available at the moment a signal was supposedly generated. In backtesting, this inflates apparent accuracy and makes a strategy look far more reliable than it performs live. The result is a chart that appears to predict price movements with uncanny precision, but only because it already knows where price went.
In Pine Script, the most common technical culprit is "request.securitycalled withlookahead=barmerge.lookahead_on`. This setting causes the indicator to read forming higher timeframe bars and display their final values during historical replay, even though those values were not finalized in real time. Think of it as giving the indicator a time machine: it shows you the completed candle data while the candle was still forming. Historically, the chart looks perfect. Live, the signal never appears as shown.

A second common mechanism is intrabar plotting, where signals are drawn based on price activity within a bar rather than at its confirmed close. The bar may shift direction before closing, causing the signal to move or disappear entirely. Traders watching a live chart see one thing; the historical chart later shows something different.
Here is a breakdown of the most common technical causes:
request.securitywithlookahead_on: Reads incomplete higher timeframe bar data and displays final values retroactively.- Intrabar signal plotting: Draws signals based on mid-bar price, which changes before bar close.
- Pivot and swing detectors: These require future bars to confirm a pivot, so the signal only appears after the fact.
- Dynamic exit rules referencing current bar: Exit conditions that update continuously during bar formation cause historical signals to shift.
- Offset misuse: Using negative offsets to shift plotted data backward creates the visual illusion of earlier, more accurate signals.
Pro Tip: When reviewing any Pine Script indicator, search the source code for lookahead_on and any negative offset values in plot() calls. Either one is a strong signal that the indicator may repaint.
Note that barstate.isconfirmed reduces some intrabar signal instability but does not solve repainting caused by higher timeframe logic or poorly designed exit rules. It is a partial fix, not a complete solution.
What traders miss about repainting: behavioral and risk consequences
The damage from repainting indicators goes well beyond a few bad trades. The psychological impact is where the real harm accumulates, and most traders never connect the dots between their indicator and their deteriorating confidence.
When a trader backtests a repainting indicator, the historical chart shows visually perfect signals that appear to catch every major move. This creates a false sense of mastery. The trader believes they have found an edge, sizes up their positions, and enters live markets with high conviction. When the signals fail to materialize as expected, the trader assumes the problem is their own execution, not the tool.
This misattribution is where behavioral damage compounds. Traders experiencing unexpected losses from repainting-induced signal shifts often fall into revenge trading cycles, increasing position size to recover losses that were never their fault to begin with. The indicator looked right on the chart. The trade felt justified. The outcome was predetermined by a flawed tool.
Key behavioral risks tied to repainting indicators include:
- Overconfidence from backtest visuals: A 90% win rate on a repainted chart means nothing in live trading.
- Blame misattribution: Traders fault their discipline rather than the indicator, eroding self-trust.
- Overtrading and burnout: Chasing signals that keep shifting leads to excessive trade frequency and emotional exhaustion.
- Distorted risk management: Position sizing based on inflated backtest results exposes traders to far more risk than their strategy actually supports.
- Automation failures: Repainting indicators can produce visually perfect historical charts but fail to fire live alerts, since signals occur retroactively. Automated systems built on these tools simply do not execute as designed.
"Backtesting on repainted final indicator values is equivalent to cheating with future data. The strategy never had the edge the backtest suggested."
The counterintuitive truth is that a slight lag in a signal is a sign of reliability, not weakness. An indicator that waits for bar close confirmation before committing to a signal will always appear less impressive on a historical chart. That delay is exactly what makes it trustworthy in live conditions. Understanding trading entry signals and how they should behave at bar close is foundational to avoiding this trap.
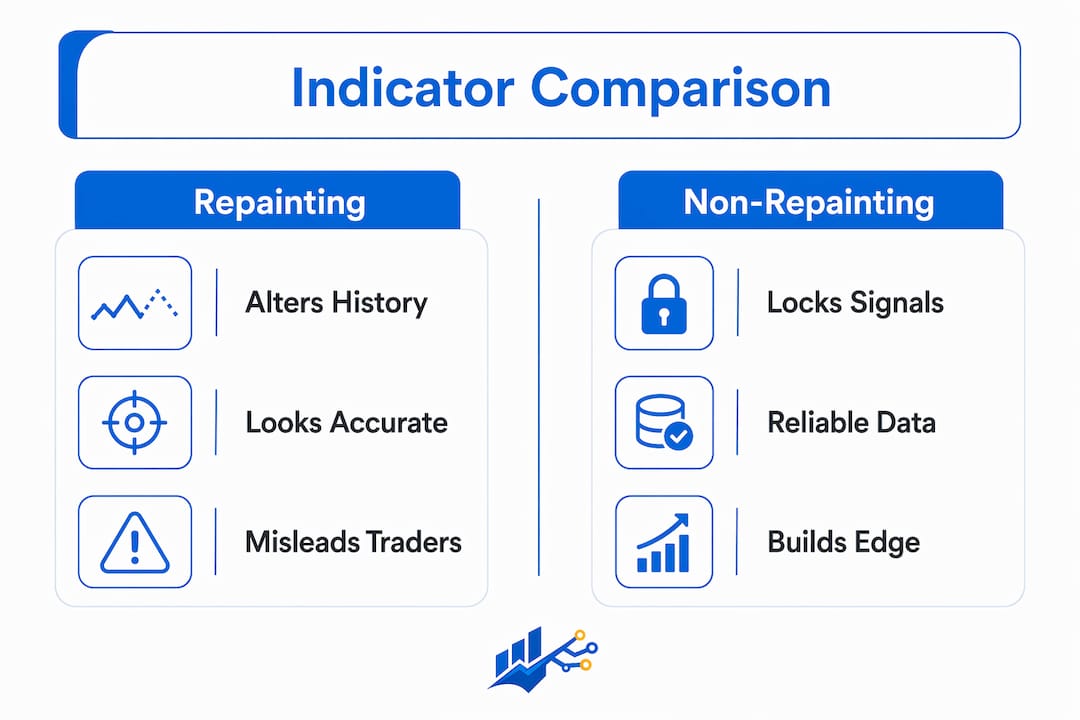
Repainting vs. non-repainting indicators: how do they compare?
A non-repainting indicator locks its signals after bar close and does not alter past plotted points, allowing traders to trust historical signals for live decision making. The signal you see on a historical bar is the exact signal that would have appeared in real time. That consistency is the entire value proposition.
The comparison between the two types is stark once you understand what to look for:
| Feature | Repainting indicator | Non-repainting indicator |
|---|---|---|
| Historical accuracy | Appears very high | Reflects true live performance |
| Live signal reliability | Unpredictable, shifts mid-bar | Stable, confirmed at bar close |
| Backtest validity | Inflated, misleading | Accurate representation of edge |
| Alert reliability | Alerts may never fire as shown | Alerts match chart signals |
| Suitable for automation | No | Yes |
| Trust over time | Erodes with live use | Builds with consistent results |
Simple moving averages, for example, do not repaint. The value plotted on a closed bar never changes. Pivot detectors, by contrast, almost always repaint because they require future bars to confirm that a swing high or low has formed. The signal appears only after the fact, making them visually impressive but operationally unreliable.
Pro Tip: Use TradingView's Bar Replay tool to test any indicator you are considering. Load the indicator, start the replay from a point months in the past, and watch whether signals appear and then disappear or shift as new bars form. If they do, the indicator repaints.
Anti-repainting is a fundamental system design principle, not an optional switch. Robust indicators prohibit referencing forming bar data at the architecture level, not as an afterthought.
Practical strategies to avoid repainting indicator pitfalls
Protecting yourself from repainting indicators requires a combination of code-level auditing, behavioral discipline, and smarter tool selection. The following steps give you a structured approach.
-
Audit the source code before trusting any indicator. Open the Pine Script editor and search for
lookahead_on, negative offsets inplot(), and anyrequest.securitycalls. These are the primary red flags. If the code is locked and you cannot inspect it, treat the indicator with skepticism until you have verified its behavior through replay testing. -
Run the Bar Replay test on every new indicator. The quickest practical test for repainting is to load an indicator, scroll back months, and compare current values versus historical snapshots. Differences confirm repainting behavior. This takes five minutes and can save you weeks of losses.
-
Gate all entries and alerts on confirmed bar data. Consistency in gating entries and alerts to confirmed bar data reduces repaint confusion and improves operational reliability. Never enter a trade or set an alert based on a signal that has not yet closed its bar.
-
Set realistic performance expectations. A non-repainting indicator with a 65% win rate is worth far more than a repainting indicator claiming 90%. Calibrate your expectations to live performance, not backtest visuals. Learn how trading indicators generate profits in real conditions to set a proper baseline.
-
Separate your entry logic from your alert logic. Many repainting complaints arise from a mismatch between entry logic and alert logic, where entries rely on closed-bar confirmation but alerts trigger intrabar. Write both to reference only completed bar data, and test them independently before going live.
-
Apply conservative position sizing during any indicator evaluation period. Even after passing a replay test, trade any new indicator at reduced size for at least 20 to 30 live trades before scaling up. Live performance is the only performance that matters.
Key takeaways
Repainting indicators destroy trading edge by substituting future data for real-time data, making backtests look profitable while live performance consistently fails to match.
| Point | Details |
|---|---|
| Repainting defined | Indicators that alter past signals using data unavailable at the original decision point. |
| Core technical cause | Pine Script functions like request.security with lookahead_on read incomplete bar data and display final values retroactively. |
| Behavioral damage | False backtest accuracy creates overconfidence, misattributed losses, and revenge trading cycles. |
| Detection method | Use TradingView's Bar Replay tool and inspect source code for lookahead_on and negative offsets. |
| Reliable alternative | Non-repainting indicators lock signals at bar close, delivering stable alerts and trustworthy historical records. |
The uncomfortable truth I've learned about repainting traps
I spent the better part of a year convinced I was a poor executor. My entries were sloppy, my timing was off, my discipline needed work. That was the story I told myself every time a signal I had acted on failed to play out. It took me far too long to realize the indicator I was using was repainting, and that the beautiful backtest I had trusted was built on data I never had access to in real time.
The hardest part of that experience was not the financial loss. It was recognizing that the tool I had trusted most was the one working against me. Repainting indicators do not fail loudly. They fail quietly, trade by trade, while you absorb the blame.
What I have come to believe is that a slight lag in a signal is not a flaw. It is proof that the indicator is waiting for real information before committing. Traders who chase the most visually impressive backtest results are almost always chasing repainting tools. The indicators that look slightly less exciting on a historical chart are frequently the ones that actually perform in live conditions.
The mindset shift that matters most is this: stop optimizing for how good a strategy looks in the past and start optimizing for how consistent it is in the present. Transparency in indicator design, specifically whether a developer openly documents their anti-repainting architecture, is now one of the first things I check before evaluating any new tool.
— Tran
How Quantlogicx eliminates the repainting problem for active traders
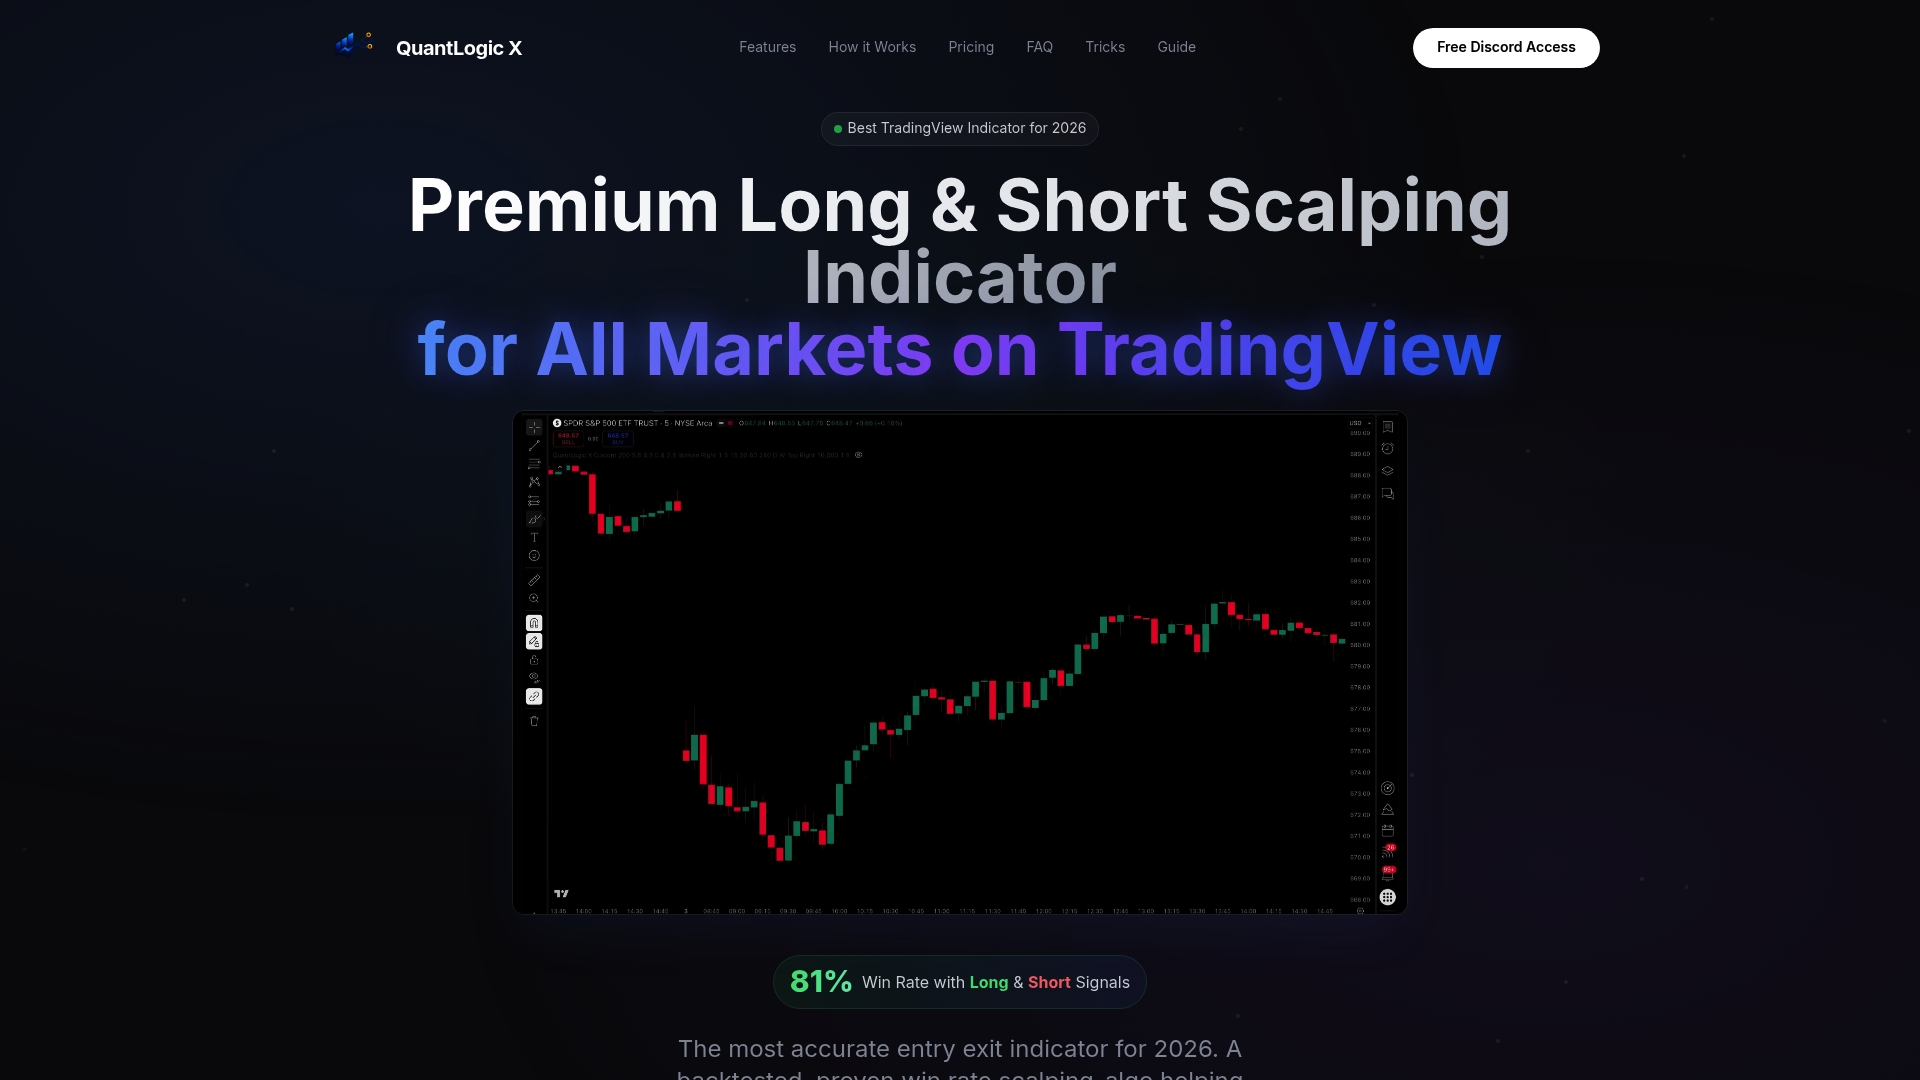
Quantlogicx was built around a single non-negotiable principle: every signal must be accurate at bar close, with no retroactive changes. The QuantLogic X TradingView indicator uses confirmed bar logic throughout its architecture, meaning the long and short signals you see on a historical chart are identical to what appeared in real time. Over 2,000 traders across stocks, forex, and cryptocurrency have adopted this algorithm, with individual users recording gains of $8,200 within a single month. The platform delivers real-time alerts that match chart signals exactly, so what you see is what fires. For traders who are done second-guessing their tools, the QuantLogic X indicator offers an 81% win rate built on data you can actually trust.
FAQ
What does it mean when an indicator repaints?
Repainting means the indicator retroactively changes its historical signals after new price data arrives, making past performance appear more accurate than it was in real time. Traders relying on these signals for live decisions will find the chart history does not match what they saw when the signal originally appeared.
How can I tell if a TradingView indicator repaints?
Use TradingView's Bar Replay tool to run the indicator forward from a historical date and watch whether signals appear and then shift or disappear as new bars form. You can also inspect the Pine Script source code for lookahead_on settings or negative offsets in plot() calls.
Why are repainting indicators so common on TradingView?
Many Pine Script developers use request.security with lookahead enabled or plot signals based on intrabar data without realizing the repainting consequence. The resulting indicator looks highly accurate in backtests, which makes it attractive to share, even though live performance is unreliable.
Does using barstate.isconfirmed fix repainting completely?
No. barstate.isconfirmed addresses intrabar signal instability but does not resolve repainting caused by higher timeframe logic or flawed exit rule design. It is a useful tool but not a complete solution on its own.
Are non-repainting indicators less accurate than repainting ones?
Non-repainting indicators appear less accurate on historical charts because they do not use future data. Their live performance is far more consistent precisely because every signal reflects information that was actually available at the time of the trade.