
Trading indicator performance measurement is defined as the systematic process of applying profitability, risk, and statistical validation metrics to determine whether an indicator generates a genuine edge or merely fits historical noise. The most reliable ways to measure trading indicator performance combine core metrics like Profit Factor, Sharpe Ratio, and Win Rate with advanced tests including permutation analysis, Deflated Sharpe Ratio, and Walk Forward Analysis. Sources including TradingWyckoff, Aligrithm, and MetricGate have formalized these methods into repeatable frameworks that serious traders use before committing capital. Relying on any single number from a backtest is one of the most common and costly mistakes in quantitative trading.
What are the essential metrics to evaluate trading indicators?
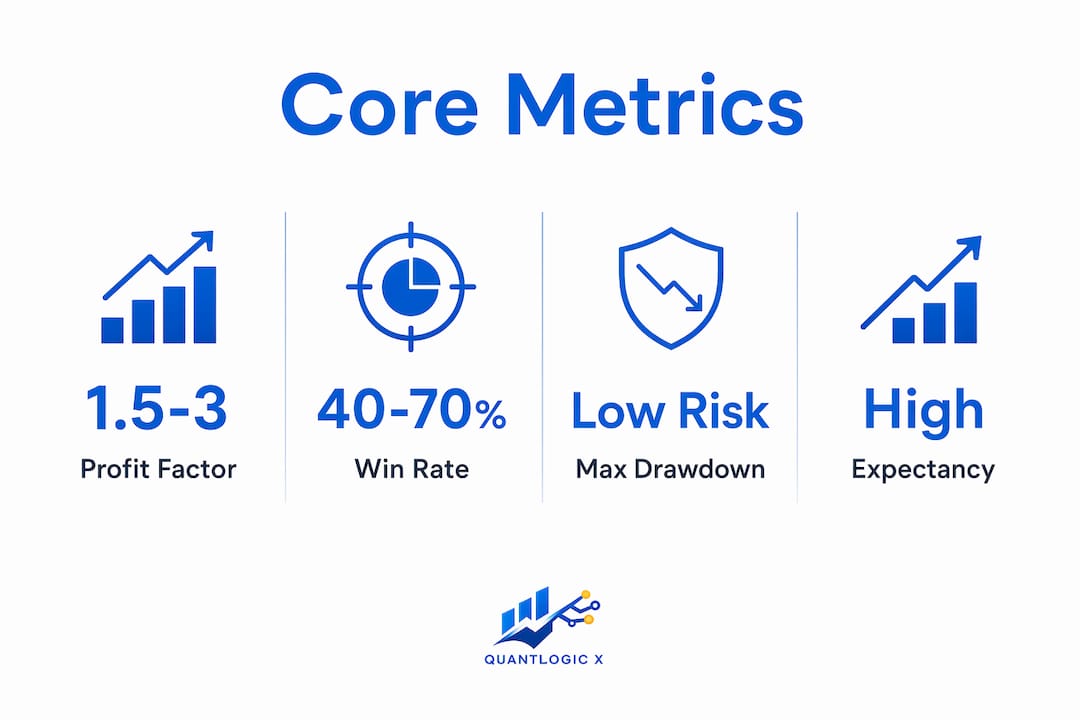
Core backtest metrics for evaluating indicator strategy include Net Profit, Profit Factor, Win Rate, Maximum Drawdown, Sharpe Ratio, Expectancy, and equity curve stability. Each metric answers a different question about your indicator, and no single one tells the full story. TradingWyckoff groups these into six categories: profitability, efficiency, risk, risk-adjusted return, expectancy, and behavioral consistency. That structure is worth borrowing directly.
Profitability and efficiency metrics
Net Profit is the total return after all costs. It confirms whether the indicator made money, but says nothing about how much risk was taken to earn it. Profit Factor divides gross profit by gross loss. A Profit Factor above 1.5 is considered acceptable; above 2.0 is strong. Anything above 4.0 should trigger skepticism, not celebration.

Win Rate measures the percentage of trades that close profitably. A 40% Win Rate with a 1:3 risk/reward ratio can outperform a 60% Win Rate with a 1:0.5 ratio, which proves that Win Rate alone is a misleading headline number. The combination of Win Rate and average win/loss size determines true profitability.
Risk and risk-adjusted metrics
Maximum Drawdown measures the largest peak-to-trough decline in your equity curve. It sets the floor for how much pain you must tolerate to capture the strategy's returns. Sharpe Ratio divides excess return by standard deviation of returns. A Sharpe above 1.0 is acceptable for most strategies; above 2.0 is excellent. These two metrics together tell you whether the returns justify the volatility.
Expectancy calculates the average dollar amount you expect to gain or lose per trade. It combines Win Rate, average win, and average loss into one number that directly answers whether the indicator is worth trading at all.
| Metric | What it measures | Healthy range |
|---|---|---|
| Profit Factor | Gross profit / gross loss | 1.5 to 3.0 |
| Sharpe Ratio | Risk-adjusted return | Above 1.0 |
| Maximum Drawdown | Worst equity decline | Below 20% |
| Win Rate | % of profitable trades | Context-dependent |
| Expectancy | Average profit per trade | Positive value |
Pro Tip: Never evaluate an indicator with fewer than 100 trades in the backtest. Below that threshold, any metric you calculate is statistically unreliable. Aim for 300 or more trades before drawing conclusions.
How to apply statistical tests for validating indicator effectiveness
Raw backtest metrics confirm what happened in your historical data. Statistical tests determine whether what happened was meaningful or accidental. This distinction separates professional traders from retail traders who over-optimize and then lose money live.
Permutation tests
Permutation tests assess whether an indicator's predictive power exceeds what randomness alone would produce. The procedure involves shuffling the indicator's values 10,000 times while keeping the return series fixed, then computing the test statistic each time. The fraction of permutations that produce a more extreme result than the original gives you a p-value. A p-value below 0.05 indicates the indicator has statistically significant predictive power. This method avoids fragile parametric assumptions and preserves return autocorrelation and volatility clustering that simpler tests ignore.
Deflated Sharpe Ratio
The Deflated Sharpe Ratio corrects for two problems that inflate standard Sharpe calculations: multiple testing bias and non-normal return distributions. When you test dozens of parameter combinations and pick the best, the winning Sharpe is artificially high. The DSR adjusts for this by computing the probability that the true Sharpe exceeds a benchmark. A DSR above 0.95 indicates a genuine edge. Treat DSR as a probabilistic gate, not just another number to maximize.
Probability of Backtest Overfitting and CSCV
Probability of Backtest Overfitting (PBO) measures the chance that the strategy selected as best in-sample performs worse out-of-sample. It uses Combinatorially Symmetric Cross-Validation (CSCV) to split your data into multiple sub-periods and evaluate how often the in-sample winner loses out-of-sample. A PBO above 0.5 means your optimization process is more likely to select a poor strategy than a good one. That is a direct signal to simplify your parameter space.
Here is a practical sequence for applying these tests:
- Run your backtest and collect the raw metrics (Profit Factor, Sharpe, Win Rate).
- Apply a permutation test to confirm the indicator's predictive power is not random.
- Calculate the Deflated Sharpe Ratio to correct for multiple testing if you optimized parameters.
- Compute PBO using CSCV to quantify overfitting risk across your parameter combinations.
- Run Monte Carlo resampling using block bootstrap to stress-test the metric distribution.
Pro Tip: Block bootstrap resampling samples contiguous bars rather than individual days. This preserves autocorrelation and volatility clustering in your return series. Naive day-by-day resampling produces overly optimistic confidence intervals that will mislead you.
How to use walk-forward analysis and robustness testing
Walk Forward Analysis (WFA) is the closest simulation of live trading you can run before deploying real capital. It works by repeatedly optimizing your indicator parameters on an In-Sample (IS) window, then testing the optimized parameters on a subsequent Out-of-Sample (OOS) window. The process rolls forward across your full data history, producing a sequence of OOS results that approximate how the indicator would have performed in real time.
The key output to watch is the Walk Forward Ratio, which divides OOS performance by IS performance. A ratio above 0.5 indicates the indicator generalizes well beyond the data it was optimized on. A ratio below 0.5 suggests the parameters are too tightly fitted to the IS period. Walk Forward Analysis produces equity sequences closer to live trading outcomes than any single backtest split.
Robustness testing extends this further through Monte Carlo simulations. The standard procedure involves:
- Freezing your indicator parameters after WFA optimization
- Resampling OOS returns 500 to 2,000 times using block bootstrap
- Analyzing the full distribution of Profit Factor, Sharpe, and Drawdown across all simulations
- Identifying the 5th percentile outcome as your realistic worst-case scenario
You should also define clear stopping criteria before going live. If the live equity curve drops more than 50% of the maximum historical drawdown, pause trading and re-evaluate. If the Sharpe Ratio drops below 0.5 over a rolling 90-day window, treat that as a signal to retest the indicator on recent data. Automating these checks with tools like DisciplineAI or custom TradingView alerts removes the emotional friction from the decision.
Pro Tip: Use a minimum IS-to-OOS ratio of 3:1 in your walk-forward windows. Shorter OOS periods produce noisy results; longer IS periods risk overfitting to stale market regimes.
What are common mistakes when measuring trading indicator performance?
The most damaging mistake traders make is treating a high Win Rate as proof of a good indicator. A strategy that wins 70% of trades but loses three times more on losers than it gains on winners has a negative expectancy. It will destroy your account slowly and convincingly. Win Rate must be evaluated alongside risk/reward ratio and expectancy before you draw any conclusions.
The second most common error is trusting a backtest with suspiciously perfect metrics. A Sharpe Ratio above 3, a Profit Factor above 4, a Maximum Drawdown below 5%, and a smooth equity curve do not indicate a great strategy. They indicate overfitting. Real markets produce friction, slippage, and regime changes that no optimized parameter set can perfectly anticipate.
Execution realism is another area where traders consistently underestimate costs. Measuring indicator performance reliably requires modeling next-bar entry timing and realistic transaction costs, not idealized fills at the signal bar's close. A strategy that looks profitable at zero cost often breaks even or loses once you add a realistic spread and commission.
"The goal of backtesting is not to find a strategy that worked in the past. It is to find a strategy whose past performance is statistically likely to persist into the future." This distinction drives every best practice in indicator evaluation.
Sample size is the final constraint most traders ignore. You need at least 300 trades for basic statistical reliability, and 1,000 or more trades to draw firm conclusions about metrics like Sharpe Ratio and Maximum Drawdown. Anything below that threshold gives you noise dressed up as signal. If your indicator generates only 50 trades per year, you need multiple years of data before your backtest metrics mean anything.
Key takeaways
Measuring trading indicator performance requires combining profitability metrics, risk metrics, and statistical validation tests because no single number reliably distinguishes genuine edge from overfitting.
| Point | Details |
|---|---|
| Use multiple core metrics | Evaluate Profit Factor, Sharpe Ratio, Win Rate, and Expectancy together, never in isolation. |
| Apply permutation tests | Confirm predictive power exceeds randomness with a p-value below 0.05 before trusting any metric. |
| Correct for multiple testing | Use Deflated Sharpe Ratio to adjust for selection bias when optimizing parameters across many combinations. |
| Validate with walk-forward analysis | Require a Walk Forward Ratio above 0.5 and stable OOS performance before deploying capital. |
| Respect sample size requirements | Use 300 or more trades for basic reliability and 1,000 or more for firm statistical conclusions. |
Why most traders measure indicators wrong, and what actually works
I have reviewed hundreds of backtests from traders who were convinced they had found an edge. The pattern is almost always the same. They found a parameter set that produced a beautiful equity curve, reported a Profit Factor of 3.5 and a Win Rate of 68%, and called it validated. When I asked whether they had run a permutation test or calculated the Deflated Sharpe Ratio, the answer was almost always no.
The uncomfortable truth is that most retail backtesting is sophisticated curve-fitting. The tools are accessible, the data is cheap, and the optimization engines are powerful. That combination makes it easy to find parameter combinations that fit the past perfectly and predict the future not at all. Walk Forward Analysis and Monte Carlo stress testing are not optional extras for advanced traders. They are the minimum standard for knowing whether your indicator has any real predictive value.
What I have found actually works is treating validation as a pipeline, not a checklist. You run the core metrics first to filter out obvious failures. Then you apply permutation tests to confirm statistical significance. Then you calculate the Deflated Sharpe Ratio to correct for the number of parameter combinations you tested. Then you run Walk Forward Analysis to simulate live trading. Only after passing all four stages do you consider the indicator worth trading. Tools like Quantlogicx, which uses zero-repaint signal technology, make it easier to start with a clean signal before you even begin this process. Repainting indicators corrupt every metric you calculate because the historical signals do not match what you would have seen in real time.
Patience in this process is not optional. Rushing from backtest to live trading because the metrics look good is how traders lose money with statistical confidence.
— Tran
See how Quantlogicx simplifies performance tracking
Quantlogicx is built for traders who take performance measurement seriously. The QuantLogic X indicator delivers zero-repaint long and short signals directly on TradingView, which means every historical signal you see in your backtest is exactly what you would have seen in real time. That integrity is the foundation of any reliable performance measurement process. Over 2,000 traders across stocks, forex, and cryptocurrency use Quantlogicx to generate signals with an 81% win rate, with individual users recording gains of $8,200 within a single month. If you want to apply the evaluation methods covered in this article to a signal source you can actually trust, explore the full indicator suite and see the performance data for yourself.
FAQ
What is the most reliable metric for evaluating a trading indicator?
No single metric is most reliable on its own. Profit Factor, Sharpe Ratio, and Expectancy must be evaluated together, and all three should be validated with statistical tests like permutation analysis before drawing conclusions.
How many trades do I need for a valid indicator backtest?
You need a minimum of 300 trades for basic statistical reliability, and 1,000 or more trades to draw firm conclusions about risk-adjusted metrics like Sharpe Ratio and Maximum Drawdown.
What does a Walk Forward Ratio above 0.5 mean?
A Walk Forward Ratio above 0.5 indicates that your indicator's out-of-sample performance is at least half as strong as its in-sample performance, which suggests the parameters generalize reasonably well to unseen data.
How do I know if my backtest is overfitted?
A Probability of Backtest Overfitting (PBO) above 0.5 signals that your optimization process is more likely to select a poor out-of-sample strategy than a good one. Suspiciously perfect metrics like a Sharpe above 3 or a Profit Factor above 4 are also strong overfitting signals.
What is the Deflated Sharpe Ratio and when should I use it?
The Deflated Sharpe Ratio corrects for multiple testing bias and non-normal return distributions in backtest results. Use it whenever you have tested more than one parameter combination, which means you should use it in almost every optimization exercise.