
A win rate trading indicator is defined as the percentage of trades that result in a profit out of all trades executed, calculated as (winning trades ÷ total trades) × 100%. Platforms like TradingMetrics and Quantlogicx use this metric to give traders a clear, quantifiable read on how often their strategy produces a winning outcome. Understanding the win rate indicator definition is the starting point for any serious performance review, but the number alone tells only part of the story. A 55% win rate means 55 profitable trades out of 100 executed, yet whether that translates to actual profit depends entirely on what happens during the other 45%.
What is the win rate trading indicator and how is it calculated?
Win rate is the percentage of trades that end in profit over total trades executed. The formula is straightforward: divide your winning trades by your total trades, then multiply by 100. If you closed 70 profitable trades out of 120 total, your win rate is 58.3%.
The nuance comes in how you handle break-even trades. Break-even trades are commonly excluded from win rate calculations to provide a clearer picture of profitability frequency, though some traders count them as losses to apply a more conservative standard. The choice you make affects the final number, so consistency in your definition matters more than which method you pick.
Sample size is the other critical variable. At least 100 trades offers meaningful data across different market conditions, while a sample of 10 to 20 trades is statistically unreliable. A short winning streak on a new strategy can produce a 90% win rate over 10 trades that collapses to 52% after 200.

The table below shows how different approaches to counting trades produce different win rate results from the same raw data.
| Scenario | Winning trades | Total trades | Break-evens excluded | Win rate |
|---|---|---|---|---|
| Conservative | 55 | 105 | 5 excluded | 55.0% |
| Strict (break-evens as losses) | 55 | 110 | 5 counted as losses | 50.0% |
| Inclusive | 55 | 100 | 5 counted as wins | 60.0% |
Pro Tip: Tag each trade in your journal by strategy type. Computing win rates per approach reveals which setups are actually working instead of blending strong and weak signals into one misleading average.
Why a high win rate does not guarantee profitability
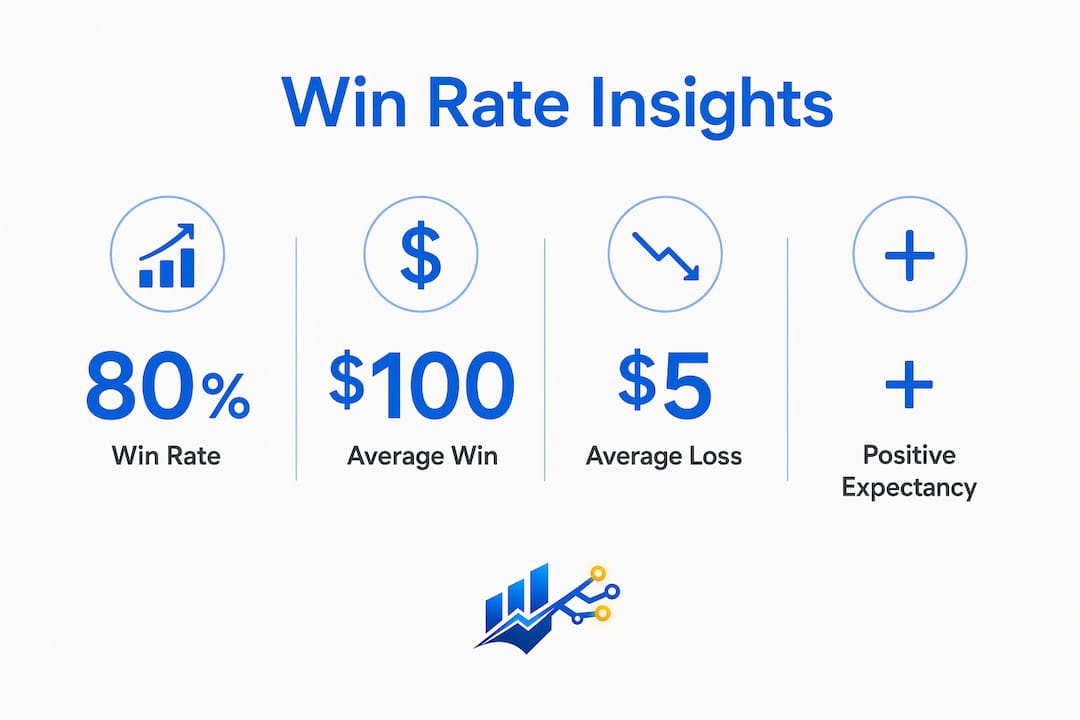
A high win rate can still bankrupt a trader if the losses in the remaining trades are much larger than the wins. This is the most common misconception in trading win rate analysis, and it catches both beginners and experienced traders off guard. Winning 80% of your trades means nothing if your average loss is five times larger than your average win.
The metric that corrects this blind spot is trade expectancy. The expectancy formula is: Expectancy = (Win Rate × Average Win) − (Loss Rate × Average Loss). A positive expectancy confirms your system has a real edge; a negative one means you are losing money on average regardless of how often you win.
Consider two traders with identical 60% win rates. Trader A wins $200 on average and loses $400 on average. Expectancy = (0.60 × $200) − (0.40 × $400) = $120 − $160 = −$40 per trade. Trader B wins $300 on average and loses $150 on average. Expectancy = (0.60 × $300) − (0.40 × $150) = $180 − $60 = +$120 per trade. Same win rate, completely opposite outcomes.
"Win rate measures frequency of correctness, not profitability. Pairing it with average win and average loss is the only way to avoid drawing misleading conclusions from your trade history." — HeyGoTrade
The comparison table below illustrates how win rate combined with risk/reward determines actual profitability across four common scenarios.
| Win rate | Avg win | Avg loss | Expectancy per trade | Profitable? |
|---|---|---|---|---|
| 80% | $100 | $500 | −$20 | No |
| 40% | $600 | $200 | +$120 | Yes |
| 60% | $200 | $400 | −$40 | No |
| 55% | $300 | $200 | +$75 | Yes |
The risk/reward ratio measures potential profit relative to potential loss per trade, and together with win rate it determines expectancy and ultimately profitability. Neither number works in isolation.
How win rate targets vary by trading style
No single best win rate exists because the right target depends entirely on your strategy. Trend-following systems typically produce win rates below 50% because most breakout attempts fail, but the trades that succeed run far enough to generate outsized returns. Mean-reversion strategies and scalping approaches tend to produce win rates above 60% because they capture frequent small moves, though each individual gain is modest.
Here is how win rate characteristics break down across common trading styles:
- Trend following: Win rates of 35% to 50% are normal. Large average wins compensate for frequent small losses. Patience and discipline with stop losses are non-negotiable.
- Scalping: Win rates of 60% to 75% are typical. Trades close quickly for small gains, so high frequency and tight spreads matter most. Quantlogicx targets an 81% win rate specifically for scalping setups.
- Mean reversion: Win rates of 55% to 70% are common. The strategy bets on price returning to a range, which works well in sideways markets but fails badly in strong trends.
- Swing trading: Win rates of 45% to 60% are standard. Holding periods of days to weeks allow larger price moves, balancing moderate win frequency with meaningful average gains.
- News trading: Win rates vary widely. High uncertainty means results depend heavily on execution speed and position sizing rather than signal frequency.
Strategies can be profitable even with win rates below 50% as long as the average winning trade exceeds the average losing trade by a sufficient margin. Chasing a 70% win rate while ignoring risk/reward is a path to consistent losses.
Pro Tip: Before targeting a specific win rate, calculate the minimum win rate your risk/reward ratio requires to break even. If you risk $100 to make $200, you need only a 33.4% win rate to cover losses. Knowing your break-even threshold removes the pressure to win on every trade.
How to use win rate data to improve your trading decisions
Win rate is a diagnostic metric calculated from your own trade history, not a market signal. Its power comes from how you apply it to evaluate, adjust, and refine your strategy over time. Here is a practical framework for incorporating win rate into your regular trading review.
- Record every trade consistently. Log entry price, exit price, trade outcome, and the strategy or setup used. Without clean data, your win rate calculation reflects noise rather than performance.
- Calculate win rate per strategy, not just overall. A blended win rate of 52% might hide one setup running at 68% and another dragging at 38%. Separating them tells you where to allocate your focus.
- Track win rate across market conditions. A strategy with a 65% win rate in trending markets may drop to 42% in choppy conditions. Knowing this prevents you from trading a setup in the wrong environment.
- Pair win rate with profit factor and drawdown. Win rate paired with profit factor and drawdown gives a fuller picture of system health than any single number. A win rate rising while drawdown deepens is a warning sign, not a reason to celebrate.
- Review weekly, not daily. Daily fluctuations in win rate create emotional noise. A weekly review smooths out variance and reveals genuine trends in your performance.
- Set a minimum sample threshold before making changes. Do not adjust a strategy after 15 trades. Wait for at least 100 trades before drawing conclusions about whether a change improved or hurt your win rate.
Win rate can improve trader confidence and guide risk management adjustments, but only when analyzed alongside other performance metrics. Traders who obsess over short-term win rate fluctuations tend to over-trade, widen stops impulsively, or abandon working strategies too early. The number is a tool for reflection, not a real-time emotional gauge.
Key takeaways
Win rate measures how often you win, but expectancy determines whether you actually make money, and both metrics must be tracked together for any trading strategy to be evaluated honestly.
| Point | Details |
|---|---|
| Win rate definition | Win rate = (winning trades ÷ total trades) × 100%, calculated from your own trade history. |
| Sample size matters | Use at least 100 trades before drawing conclusions; smaller samples produce unreliable results. |
| Win rate alone misleads | An 80% win rate can still lose money if average losses exceed average wins by a large margin. |
| Expectancy is the real measure | Combine win rate with average win and average loss to calculate whether your system has a positive edge. |
| Strategy shapes the target | Trend-following strategies can profit at 40% win rates; scalping strategies typically require 60% or higher. |
Why traders get win rate wrong, and what actually matters
I have watched traders with 70% win rates blow up accounts and traders with 42% win rates build consistent monthly income. The difference was never the win rate. It was always the relationship between average win size and average loss size.
The psychological trap is real. A high win rate feels good. Winning frequently triggers confidence, and that confidence often leads to holding losing trades too long in the hope of turning them around. The result is a win rate that looks impressive on paper while the account balance quietly erodes. I have made that mistake myself, and it took a full review of my expectancy numbers to see what was actually happening.
The traders I have seen use win rate most effectively treat it as a diagnostic signal, not a report card. When their win rate drops, they ask why before reacting. Is it a market condition change? A specific setup underperforming? A shift in volatility? The answer usually points to something fixable. Reacting emotionally to a temporary dip in win rate is one of the fastest ways to destroy a working strategy.
Tools like Quantlogicx help by providing signals with a documented 81% win rate on scalping setups, which gives traders a reliable baseline to compare against their own results. That kind of external benchmark is useful not because you should copy it blindly, but because it shows what a well-calibrated system looks like in practice. Use it as a reference point, then build your own understanding of what win rate means within your specific approach and risk tolerance.
— Tran
See your win rate in action with Quantlogicx
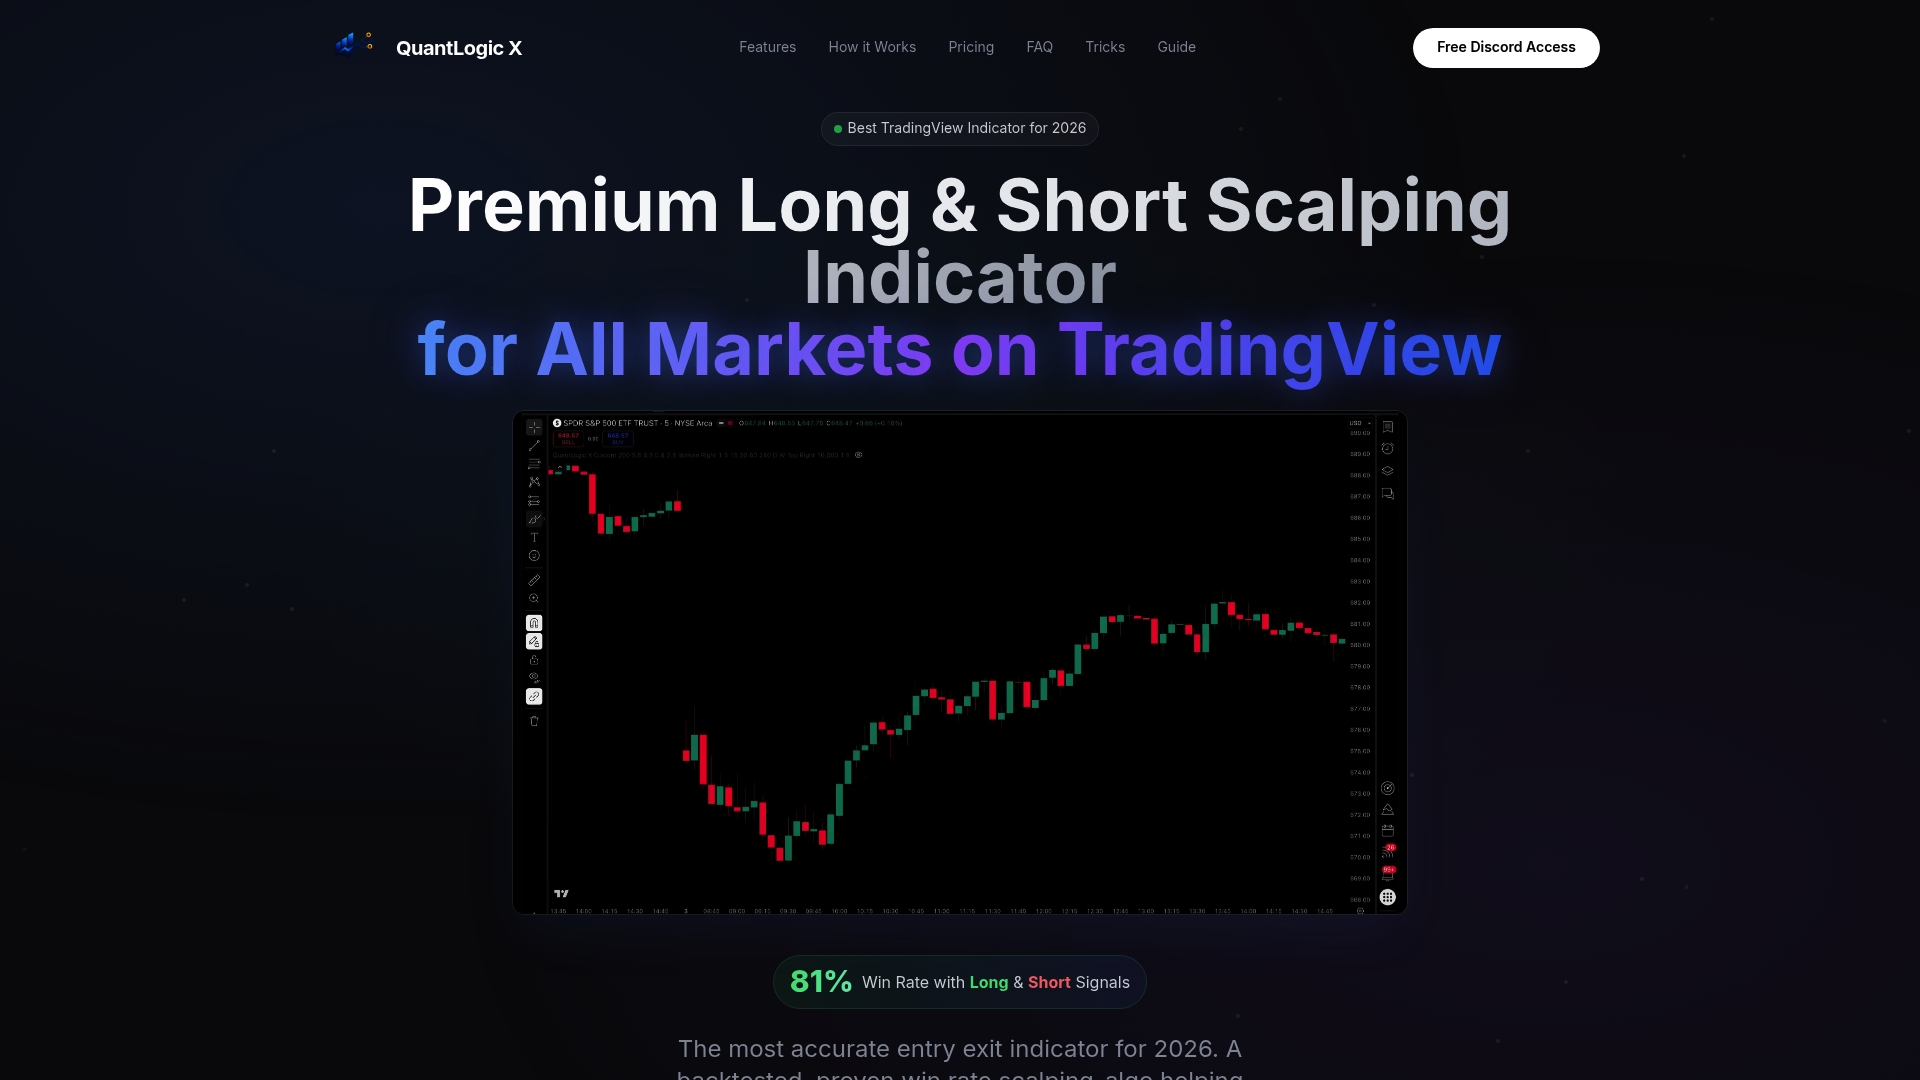
Quantlogicx is a TradingView indicator built for traders who want clear, reliable signals without the guesswork. The algorithm delivers an 81% win rate on scalping setups across forex, crypto, and stocks, using zero repaint technology so every signal you see at bar close is the signal that was generated. Over 2,000 traders have used it to track performance, validate strategies, and build confidence in their entries and exits. Whether you are learning to read win rate data for the first time or optimizing a system you have traded for years, Quantlogicx gives you the buy and sell signals and the performance data to make that evaluation meaningful. Explore the full indicator suite at Quantlogicx and see how a documented win rate changes the way you trade.
FAQ
What is a win rate trading indicator?
A win rate trading indicator is a performance metric that calculates the percentage of trades that close in profit out of all trades executed. It is expressed as (winning trades ÷ total trades) × 100% and is used to evaluate how consistently a trading strategy produces profitable outcomes.
How is win rate calculated in trading systems?
Win rate is calculated by dividing the number of winning trades by the total number of trades and multiplying by 100. Break-even trades are typically excluded to keep the calculation focused on clear wins and losses.
What is a good win rate for a trading strategy?
There is no universal good win rate. Trend-following strategies can be profitable at 35% to 45%, while scalping strategies typically require 60% or higher. The win rate must be evaluated alongside average win size and average loss size to determine actual profitability.
Can a high win rate still lose money?
Yes. An 80% win rate loses money if the average loss is significantly larger than the average win. The expectancy formula, (Win Rate × Average Win) − (Loss Rate × Average Loss), is the correct tool for determining whether a strategy has a real edge.
How many trades do I need to calculate a reliable win rate?
At least 100 trades are needed for a meaningful win rate calculation. Samples of 10 to 30 trades are too small to distinguish genuine performance from short-term variance, and conclusions drawn from them are statistically unreliable.