
A trading indicator is a mathematical calculation applied to price, volume, or open interest data that helps traders identify trends, measure momentum, gauge volatility, and time market entries and exits. These tools form the backbone of technical analysis, giving traders a structured way to interpret raw market data rather than relying on gut instinct. Indicators like the Moving Average, RSI (Relative Strength Index), and MACD (Moving Average Convergence Divergence) appear on virtually every trading platform, from TradingView to MetaTrader. Understanding what a trading indicator does, and how to use it correctly, separates traders who build consistent strategies from those who guess.
What is a trading indicator and how does it work?
A trading indicator mathematically interprets historical data such as price, volume, and open interest to generate signals about potential market direction. The calculation runs automatically on your chart, producing a visual output like a line, histogram, or band that overlays price action. When the RSI crosses above 70, it signals overbought conditions. When a short-term Moving Average crosses above a long-term one, it signals a potential uptrend. These outputs are not predictions. They are probability-weighted observations based on what the market has already done.
What makes indicators powerful is their consistency. Every trader looking at a 14-period RSI on a daily EUR/USD chart sees the same number. That shared reference point creates predictable market behavior around key levels, which is why indicators remain relevant even in algorithm-driven markets. Learning how indicators generate profits requires understanding not just what they calculate, but why other traders react to the same signals.

What are the main types of trading indicators?
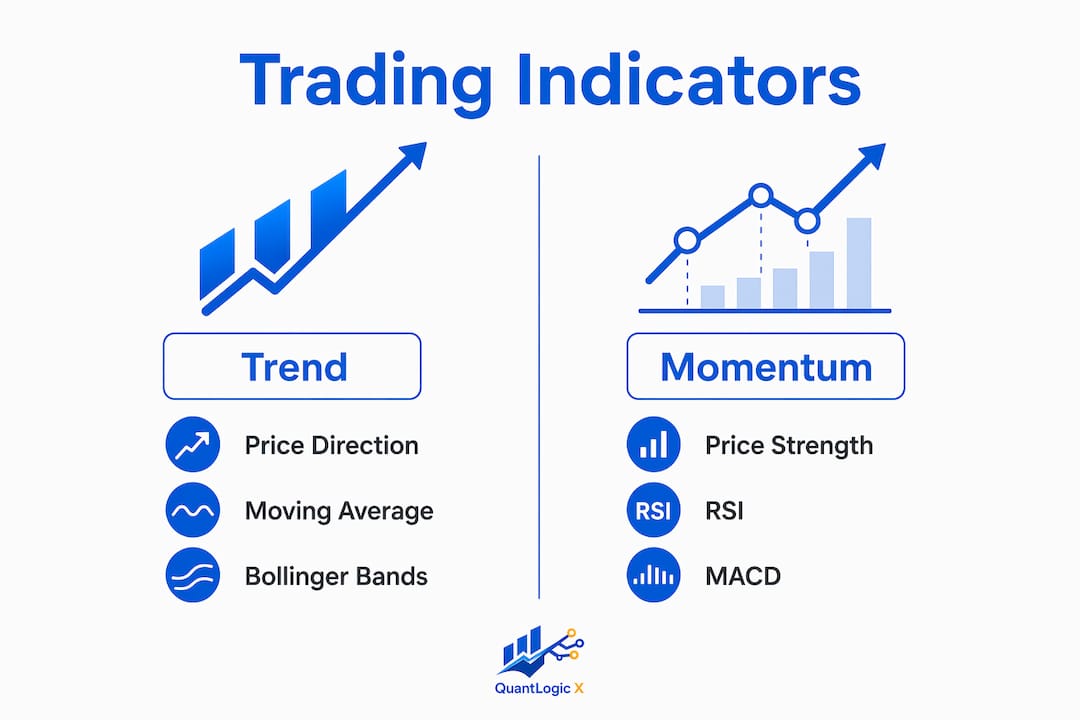
Standard trading indicators fall into four categories: trend, momentum, volatility, and volume. Each type answers a different question about market behavior, and using one from each category gives you a well-rounded picture before entering a trade.
- Trend indicators show the direction of price movement over time. Moving Averages (Simple and Exponential) are the most widely used. They smooth out price noise and reveal whether the market is moving up, down, or sideways.
- Momentum indicators measure the speed and strength of price changes. RSI and MACD are the standard examples. RSI tells you whether an asset is overbought or oversold on a scale of 0 to 100. MACD shows when momentum is shifting by comparing two exponential moving averages.
- Volatility indicators measure how much price fluctuates within a given period. Bollinger Bands expand during high volatility and contract during low volatility, signaling potential breakout conditions.
- Volume indicators track the number of units traded to confirm price moves. On-Balance Volume (OBV) adds volume on up days and subtracts it on down days, revealing whether buying or selling pressure is driving price.
Here is a quick reference for each type:
| Type | What it measures | Common examples |
|---|---|---|
| Trend | Price direction over time | Moving Average, EMA |
| Momentum | Speed and strength of price moves | RSI, MACD |
| Volatility | Range of price fluctuation | Bollinger Bands, ATR |
| Volume | Participation and conviction behind moves | OBV, Volume Profile |
Each category reveals a unique aspect of market behavior. Using only one type leaves significant blind spots in your analysis.
How do leading and lagging indicators differ and why does it matter?
Leading and lagging indicators serve fundamentally different purposes, and confusing them is one of the most common beginner mistakes. Leading indicators attempt to predict future price moves before they happen. Lagging indicators confirm that a trend or move is already underway.
RSI is a leading indicator. When it reaches extreme levels (above 70 or below 30), it suggests a reversal may be coming before the price actually turns. The Moving Average is a lagging indicator. It only reflects a trend after enough price bars have formed to shift the average. By definition, it will always be late to the party.
Neither type is superior. The real advantage comes from combining both:
- Leading indicators give early entry signals but produce more false positives, especially in trending markets where overbought conditions can persist for extended periods.
- Lagging indicators reduce false signals but cause you to enter trades later, often after a significant portion of the move has already occurred.
- Combined use means you wait for RSI to signal a potential reversal (leading) and then confirm the move with a Moving Average crossover (lagging) before executing the trade.
Pro Tip: Never use two indicators from the same category to confirm each other. RSI and Stochastic are both momentum oscillators and will almost always agree. That is not confirmation. That is redundancy dressed up as analysis.
What are the best trading indicators for beginners to master?
Experts recommend beginners focus on three indicators: one for trend, one for momentum, and one for volume. This approach builds discipline and prevents the analysis paralysis that comes from watching too many signals at once. The combination of Moving Average, RSI, and volume creates a foundational toolkit that covers the three most critical dimensions of any trade setup.
Moving Average, RSI, and MACD offer complementary perspectives that work across stocks, forex, and cryptocurrency. The Moving Average tells you the direction. RSI tells you whether the move has momentum or is running out of steam. Volume confirms whether real money is behind the price action or whether the move is thin and likely to reverse.
The concept that ties this together is the confluence rule. Using multiple non-correlated indicators together, such as trend, momentum, and volume, reduces false signals and increases confidence in trade entries. A signal that appears on only one indicator is a hint. A signal that appears across three different indicator types is a trade setup worth taking seriously.
Here is a practical sequence for applying these indicators as a beginner:
- Set your trend context. Apply a 50-period and 200-period Moving Average to your chart. If price is above both, you are in an uptrend. Only look for long setups.
- Check momentum. Look at RSI. If it is between 40 and 60 in an uptrend, momentum is neutral and a breakout is possible. If it is above 70, the move may be overextended.
- Confirm with volume. Check OBV or raw volume bars. Rising price on rising volume confirms the move. Rising price on falling volume is a warning sign.
- Wait for confluence. Only enter when at least two of the three indicators agree. One signal alone is not enough.
- Set your risk parameters. Place your stop loss below the nearest Moving Average support level before entering any position.
Pro Tip: Start with a single market and a single timeframe. Mastering the 1-hour chart on one forex pair teaches you more than scanning 20 markets with 10 indicators simultaneously.
Understanding trading entry signals in depth will sharpen how you apply these indicators to real trade setups.
What are common pitfalls when using trading indicators?
Indicators are tools, not answers, and treating them as infallible forecasts is the fastest path to consistent losses. Every indicator generates false signals. The question is not whether false signals will appear, but whether your overall strategy accounts for them.
The most damaging misconception is indicator overload. Adding more indicators to a chart does not increase accuracy. It increases noise. When you have six indicators and three of them conflict, you have not gained information. You have created a reason to second-guess every trade. Beginners often accumulate too many indicators instead of mastering a balanced, minimal set.
A second critical limitation is that indicators rely on past price and volume data and cannot account for fundamental news, earnings surprises, or geopolitical events. An RSI reading of 35 on a stock looks like an oversold buying opportunity right up until the company announces a major earnings miss. The indicator had no way to know. This is why indicators should function as guides within a broader strategy that includes risk management and awareness of the fundamental backdrop.
Watch for these specific failure patterns:
- Whipsaws in ranging markets. Trend indicators like Moving Averages generate repeated false crossovers when price moves sideways. Switching to a momentum oscillator during range-bound conditions reduces this problem.
- Divergence that never resolves. RSI can diverge from price for many candles before a reversal actually occurs. Acting on divergence too early is a common and expensive mistake.
- Confirmation bias. Traders often unconsciously select the indicators that agree with a trade they already want to take. Build your checklist before you look at the chart, not after.
Key takeaways
Trading indicators are mathematical tools that work best when combined across trend, momentum, and volume categories with strict risk management applied to every signal.
| Point | Details |
|---|---|
| Core definition | Indicators calculate historical price and volume data to signal potential market moves. |
| Four indicator types | Trend, momentum, volatility, and volume indicators each reveal a different market dimension. |
| Leading vs. lagging | Combine RSI (leading) with Moving Averages (lagging) to balance early signals with confirmation. |
| Beginner toolkit | Master Moving Average, RSI, and volume before adding any other indicators to your chart. |
| Biggest pitfall | Indicators ignore fundamentals and news; always apply them within a broader risk management framework. |
Why I stopped chasing the perfect indicator
I spent the first two years of trading adding indicators to my charts every time a setup failed. By the end of that period, I had 11 indicators running simultaneously and was more confused than when I started. The turning point came when I stripped everything back to three: a 50-period EMA, RSI, and volume. My win rate did not change overnight, but my decision-making clarity did. I stopped second-guessing entries because the rules were simple enough to follow consistently.
The traders I have seen struggle most are not the ones who lack knowledge. They are the ones who treat indicators as a search for certainty in a market that offers none. A well-placed Moving Average crossover confirmed by volume is not a guarantee. It is an edge. Edges compound over hundreds of trades. Single trades do not define a strategy.
One thing I have noticed in volatile markets, particularly in crypto during high-impact news cycles, is that indicators become temporarily unreliable. Price moves so fast that RSI can spike from 40 to 80 in two candles. In those moments, the indicator is not wrong. It is just describing a market that has temporarily broken from its normal statistical behavior. Knowing when to step back is as important as knowing when to act. The best traders I know use indicators to build conviction, not to replace judgment.
— Tran
Take your indicator strategy further with Quantlogicx
Quantlogicx builds on everything covered in this article by delivering a TradingView indicator engineered for precision across forex, crypto, and stocks. The algorithm runs on zero repaint technology, meaning the long and short signals you see at bar close are the signals that stay. Over 2,000 traders are already using it, with individual users recording gains of $8,200 in a single month.
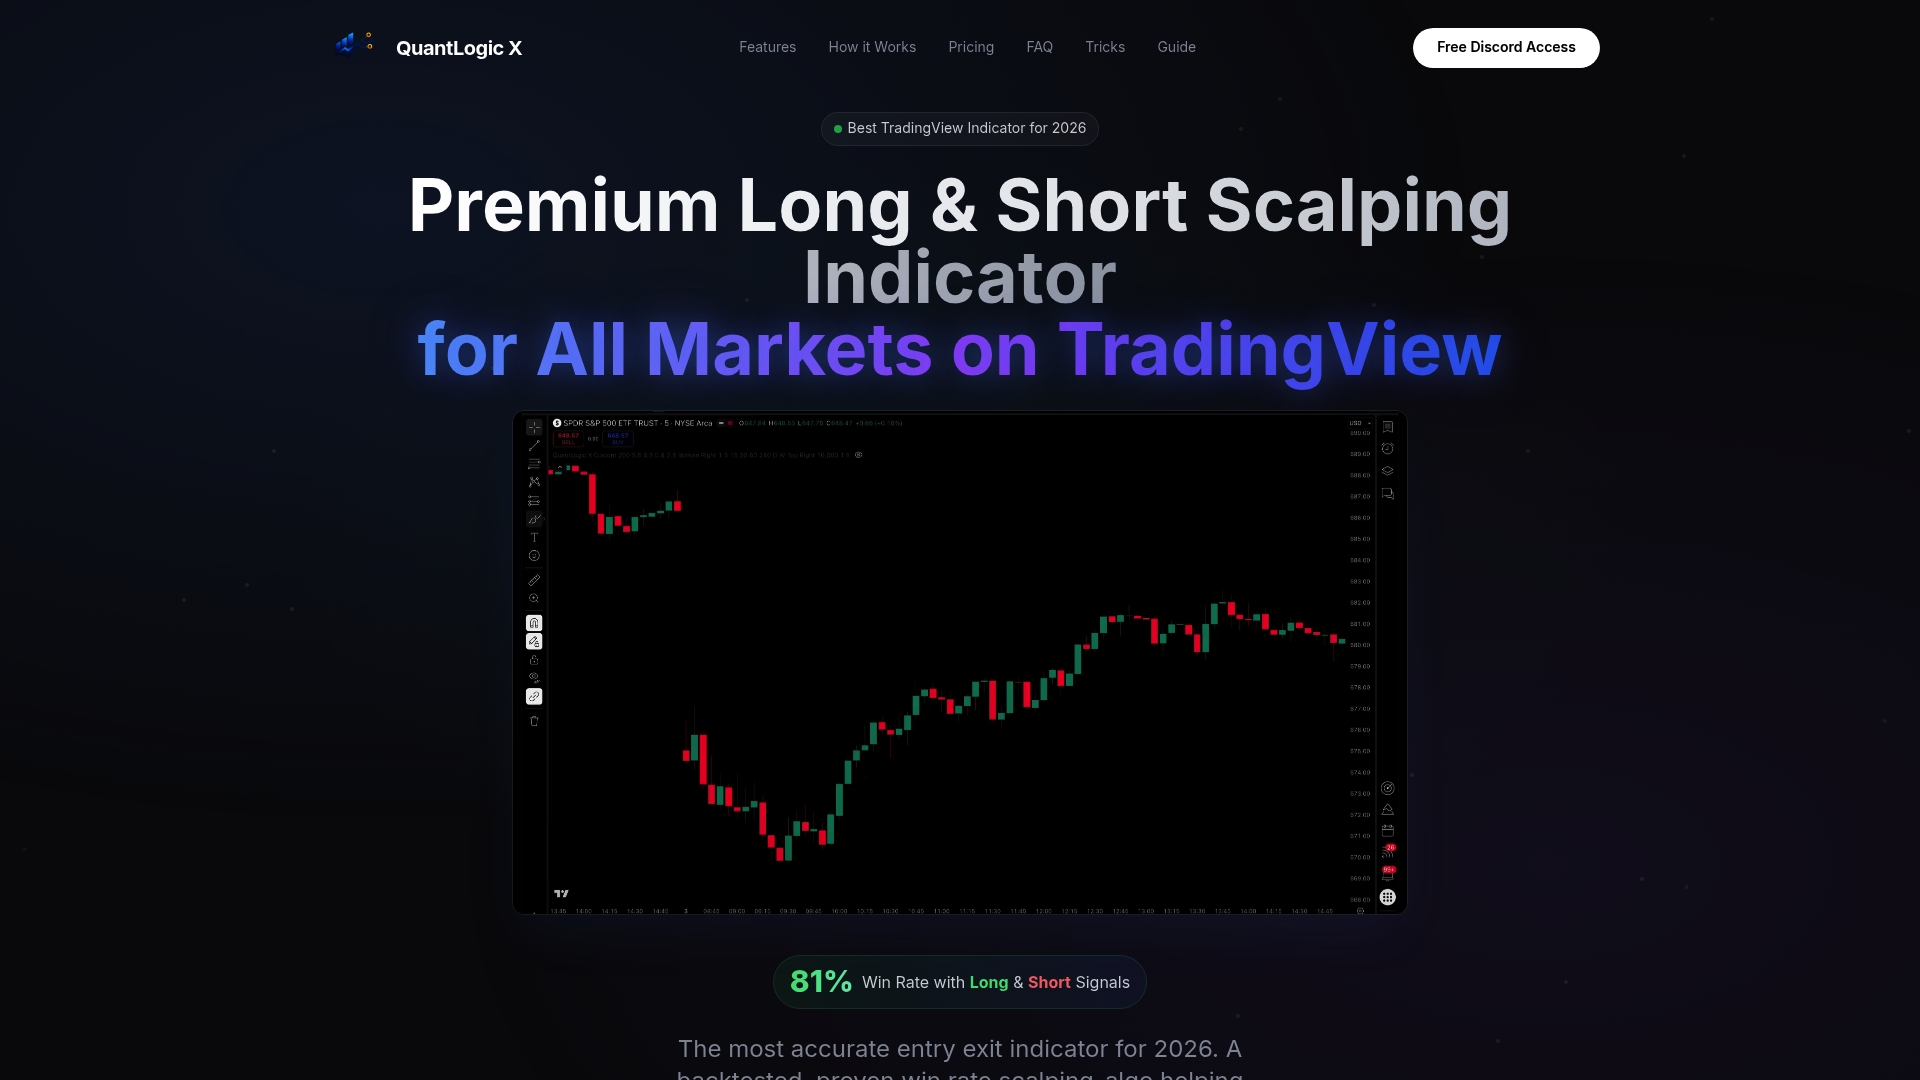
If you want to apply trend and momentum analysis without manually cross-referencing multiple indicators, the QuantLogic X indicator handles that confluence work for you. For traders focused on scalping, the best buy/sell signals for TradingView in 2026 are built directly into the platform. Real-time alerts and a community of active traders make it a practical next step for anyone ready to move from learning to executing.
FAQ
What is a trading indicator in simple terms?
A trading indicator is a mathematical formula applied to price or volume data that generates visual signals on a chart to help traders decide when to buy or sell. It does not predict the future but identifies patterns and probabilities based on historical market behavior.
What is a TradingView indicator?
A TradingView indicator is a technical analysis tool built into the TradingView platform that overlays calculations on price charts in real time. TradingView hosts thousands of built-in and community-created indicators, including RSI, MACD, Bollinger Bands, and custom algorithms like those from Quantlogicx.
How do trading indicators work for beginners?
Trading indicators process historical price and volume data through mathematical formulas and display the results as lines, histograms, or bands on your chart. Beginners should start with one trend indicator, one momentum indicator, and one volume indicator, then look for agreement across all three before entering a trade.
What are the best trading indicators for beginners in 2026?
The Moving Average, RSI, and MACD remain the strongest foundational indicators for beginners in 2026 because they cover trend direction, momentum strength, and signal confirmation without requiring advanced technical knowledge. Mastering these three before adding others builds the discipline that separates consistent traders from impulsive ones.
Can trading indicators be wrong?
Yes. Every indicator generates false signals because all indicators rely on past data and cannot account for unexpected news, earnings reports, or sudden market shifts. The solution is to use the confluence rule: require agreement from at least two non-correlated indicator types before executing any trade.