

Day trading timeframe types are defined by the chart intervals traders use to read market context, plan trade structure, and time precise entries and exits. Choosing the wrong interval is one of the most common reasons traders fail. The industry-standard approach uses three tiers: a higher timeframe for trend bias, a mid-level timeframe for setup structure, and a lower timeframe for execution. Getting this hierarchy right separates traders who react to noise from traders who act on signal.
1. What are the main day trading timeframe types?
Every intraday trading interval fits into one of three functional tiers. Each tier serves a distinct purpose, and confusing those purposes is where most traders go wrong.
- Higher timeframes (daily, 4-hour, 1-hour): These define the overall market bias. You use them to answer one question: is the market trending up, trending down, or ranging? Never enter a trade without checking this level first.
- Mid timeframes (15-minute, 5-minute): These show trade structure. You identify entry zones, support and resistance levels, and stop-loss placement here. This is where your setup lives.
- Lower timeframes (1-minute, tick): These are for execution only. You use them to time your entry with precision once the higher and mid timeframes confirm your thesis.
The 4x–6x scaling rule between timeframe tiers prevents information redundancy. Jumping from a 5-minute chart to a 6-minute chart gives you nothing new. Jumping from a 5-minute to a 1-hour chart gives you a genuinely different layer of context.
Pro Tip: Start every session on the daily chart before touching any intraday chart. Market bias set at the daily level filters out the majority of bad trades before you even look at a setup.

2. How higher timeframes set your market bias
The daily and 4-hour charts are not where you trade. They are where you think. A bullish structure on the daily chart tells you to favor long setups on lower timeframes. A bearish structure tells you to favor shorts. Ignoring this step means you are trading against the dominant flow without knowing it.
The 1-hour chart bridges the gap between the daily bias and the 5-minute setup. It shows you the most recent swing highs and lows, which define the zones where price is likely to react. Professional day traders use higher timeframes to define major structure before ever touching an execution chart.
3. How mid timeframes define your trade setup
The 5-minute and 15-minute charts are the workhorses of day trading. This is where you identify the specific entry zone, the invalidation point for your stop loss, and the target level. The industry-standard multi-timeframe setup recommends beginners start with the daily chart for bias and the 5-minute chart for execution, skipping the complexity of a full three-tier stack until they build consistency.
Stop-loss placement belongs on this tier. Your stop should sit beyond a meaningful structure level visible on the 5-minute or 15-minute chart, not on an arbitrary dollar amount. This keeps your risk tied to actual market behavior rather than personal comfort.
4. How lower timeframes sharpen your entry timing
The 1-minute chart is a precision tool, not a decision-making tool. Once your higher and mid timeframes confirm a setup, you drop to the 1-minute chart to find the exact candle pattern or momentum shift that triggers your entry. This tightens your stop distance and improves your risk-to-reward ratio without changing the trade thesis.
Micro-fluctuations on 1-minute charts lack statistical significance on their own. Traders who rely on the 1-minute chart alone mistake noise for signal constantly. The 1-minute chart only becomes useful when a higher timeframe structure already supports the trade direction.
5. Scalping vs day trading: how timeframe choice changes everything
The difference between scalping and day trading is not just style. It is a fundamentally different relationship with time, cost, and mental energy.
Day traders typically place 2–10 trades per day using 5-minute and 15-minute charts, targeting 1–3% profit per trade over 2–6 hour sessions. Scalpers trade 10–50+ times daily on 1-second to 5-minute charts, targeting fractions of a percent per trade with near-constant attention.
| Factor | Scalping (M1–M5) | Day Trading (M5–M15+) |
|---|---|---|
| Trades per day | 10–50+ | 2–10 |
| Profit target per trade | Fractions of a percent | 1–3% |
| Session attention required | Near-constant | 2–6 hours |
| Signal reliability | Lower, more noise | Higher, cleaner signals |
| Transaction cost impact | High, costs multiply fast | Moderate |
Transaction costs accumulate linearly with trade frequency. A strategy that looks profitable in backtesting can fail completely once commissions and spreads are factored in at high frequency. This is the hidden tax of scalping that most beginners never model before going live.
"Scalping is a lifestyle constraint, not just a strategy. It demands rapid decisions and induces cognitive fatigue, potentially increasing execution errors despite shorter market exposure. Higher frequency introduces the risk of catastrophic errors."
Lower timeframes produce more noise and false signals, requiring superior emotional control. Beginners are specifically cautioned against M1–M5 trading because the intensity and false breakout rate undermine learning and erode capital before any real skill develops.
6. How to choose the right timeframe combination for your style
The right short-term trading timeframe combination depends on three personal factors: how many trades you want to take per day, how much screen time you can sustain, and how large a stop loss your account can absorb.
- Define your desired trade frequency. If you want 2–5 trades per session with clear setups, the daily plus 5-minute stack is your starting point. If you want more action, add the 15-minute as a mid-tier filter.
- Size your stop to the timeframe noise. A minimum 1.5R risk-to-reward ratio is the baseline. Your stop must sit beyond the noise of your execution timeframe, or you will get stopped out on normal price movement.
- Match screen time to your energy level. Scalping demands near-constant attention. If you have a day job, a family, or limited focus windows, scalping will hurt your performance. Day trading on 5-minute and 15-minute charts fits a 2–4 hour focused session far better.
- Start with two timeframes, not three. Beginners who try to manage three charts simultaneously often freeze at decision points. Master the daily plus 5-minute combination first, then add the 1-hour as a structural filter once the two-chart workflow feels natural.
- Test your setup in a day trading routine before going live. Paper trading a specific timeframe stack for two weeks reveals whether the signal frequency and trade structure match your actual behavior under pressure.
Pro Tip: If you find yourself checking the 1-minute chart before the daily chart, your process is inverted. Flip the sequence. Top-down analysis is not optional.
7. Trade execution best practices using multi-timeframe setups
Applying a multi-timeframe structure in live trading requires a clear sequence. Skipping steps under pressure is where the system breaks down.
- Confirm market regime first. Before the session opens, check the daily and 4-hour charts. Label the trend direction and identify the key levels where price has reacted before. This takes five minutes and eliminates a large percentage of bad trades.
- Identify the entry zone on the mid timeframe. On the 5-minute or 15-minute chart, mark the specific price zone where you will look for a setup. This zone should align with a structure level from the higher timeframe.
- Wait for the lower timeframe trigger. Drop to the 1-minute chart only after the mid-timeframe zone is reached. Look for a momentum shift, a rejection candle, or a pattern that confirms the entry. Place your stop beyond the nearest structure level on the mid timeframe.
- Manage the trade from the mid timeframe. Once you are in the trade, watch the 5-minute or 15-minute chart for exit signals. Switching back to the 1-minute chart during an open trade invites emotional noise and premature exits.
- Avoid "timeframe obsession." Obsessing over 1-minute charts during a live trade causes noise-induced mistakes. Set your stop, set your target, and let the mid-timeframe structure play out.
The psychological toll of rapid decisions on ultra-low timeframes leads to cognitive fatigue and late-session errors like revenge trading. Limiting your active chart-switching to defined decision points protects your mental capital as much as your financial capital. A multi-market scalping signal strategy can help structure these decision points across markets when you are ready to scale.
Key Takeaways
The most effective day trading approach uses a three-tier timeframe stack where higher charts set bias, mid charts define setups, and lower charts time entries.
| Point | Details |
|---|---|
| Three-tier timeframe structure | Use daily/4-hour for bias, 5-minute/15-minute for setup, 1-minute for entry timing. |
| Scale timeframes by 4x–6x | Avoid redundancy by ensuring each tier shows genuinely different market information. |
| Scalping multiplies costs and fatigue | High trade frequency erodes profits through commissions and increases cognitive errors. |
| Stop loss belongs on the mid timeframe | Size stops to actual market structure, not arbitrary dollar amounts, for a minimum 1.5R ratio. |
| Beginners start with two charts | Master the daily plus 5-minute combination before adding a third timeframe tier. |
Why I think most traders pick their timeframe for the wrong reason
Most traders choose their timeframe based on excitement, not edge. The 1-minute chart feels alive. Every tick moves. There is always something happening. That feeling is the trap.
I spent months trading M1 charts and mistaking activity for opportunity. The signals were constant, the losses were constant, and the fatigue was real. What changed my results was not a better indicator. It was forcing myself to stay off the 1-minute chart until the daily and 5-minute charts both confirmed a setup. The number of trades dropped sharply. The quality went up even faster.
The hardest part of multi-timeframe analysis is not the technical setup. It is the patience to wait for alignment across all three tiers before acting. Most traders cannot sit through the 45 minutes of "nothing happening" on the 5-minute chart while the daily trend develops. They drop to the 1-minute chart, find a pattern, and take a trade that has no structural support. That trade almost always loses.
My honest advice: treat your timeframe choice as a reflection of your mental stamina, not your ambition. If you can only focus well for two hours, build a setup around the 15-minute chart and take three clean trades. That will outperform six hours of 1-minute chart exhaustion every time. Experiment with the multi-timeframe structure until you find the combination that matches how your brain actually works under pressure.
— Tran
Quantlogicx signals built for multi-timeframe day traders
Knowing which timeframe types to use is half the work. Getting clean, reliable signals across those timeframes is the other half.
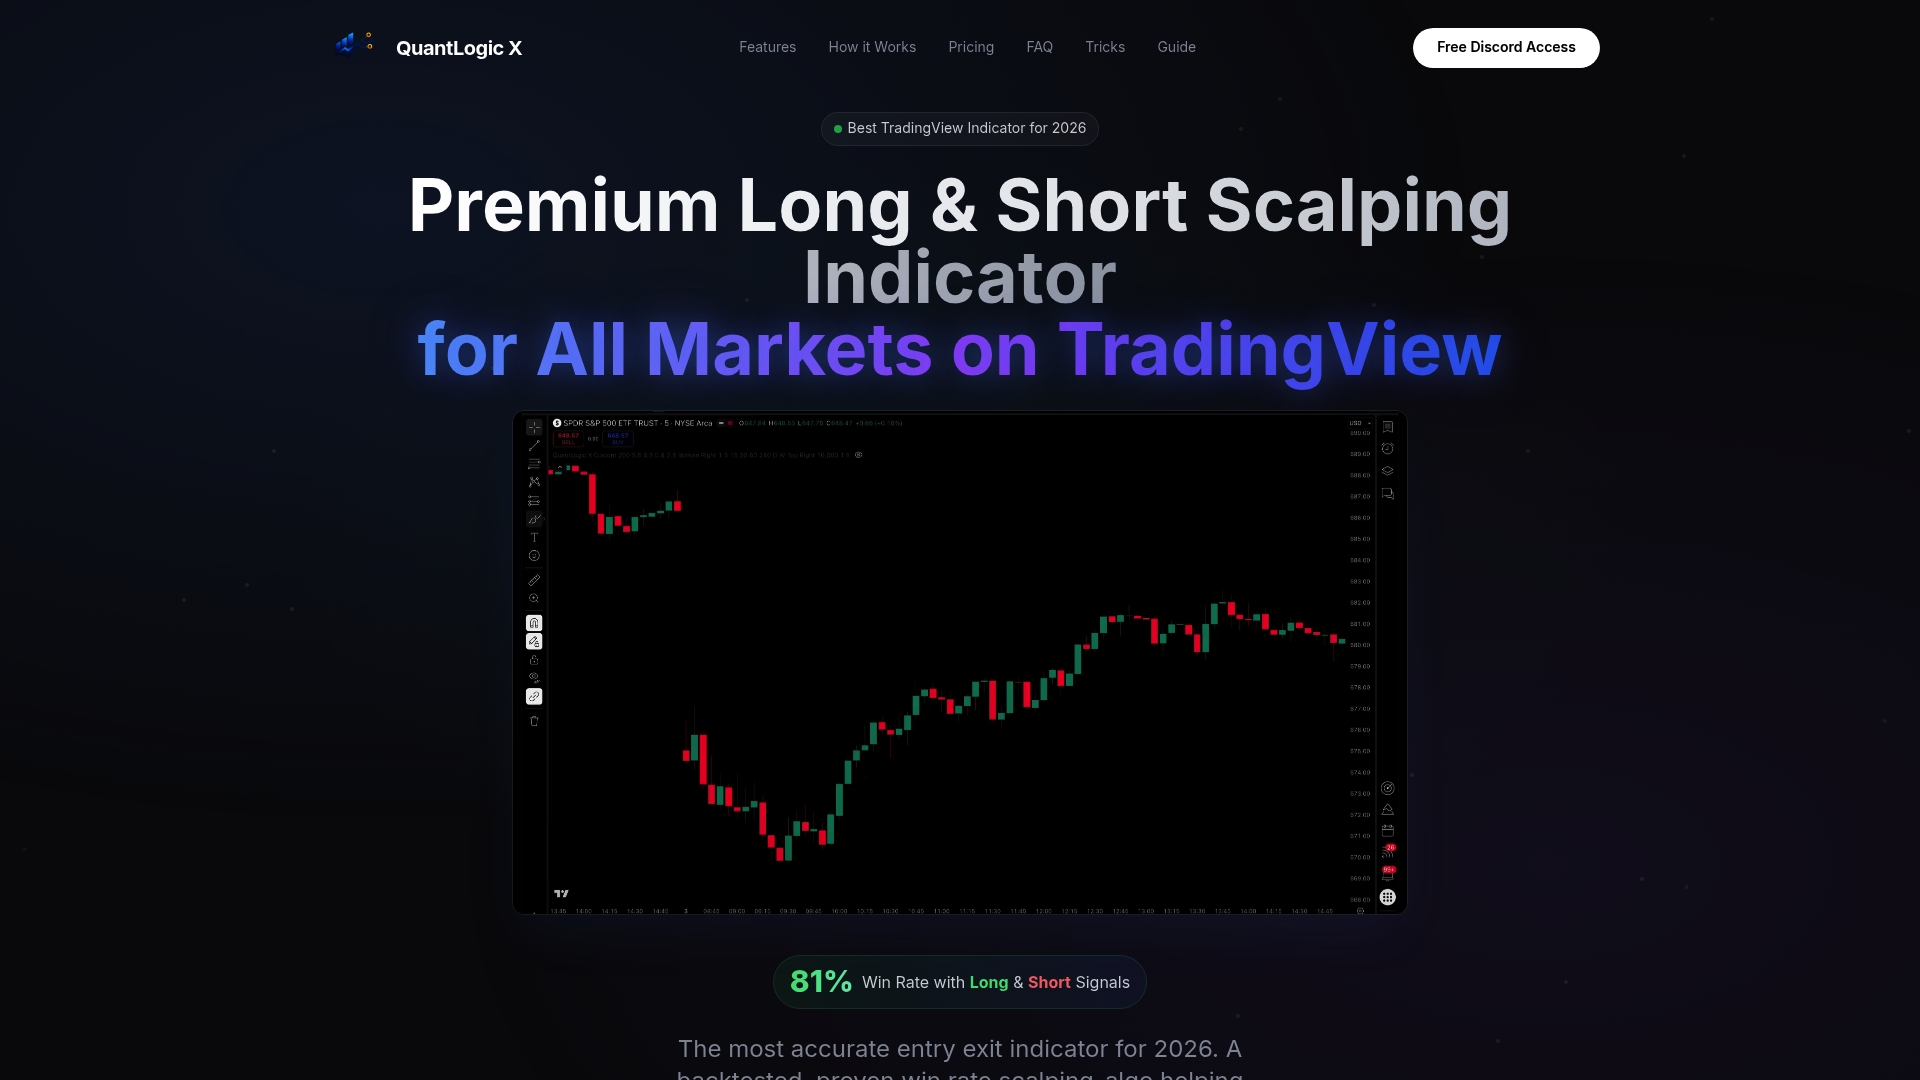
Quantlogicx is a TradingView indicator built specifically for traders who need signals that hold up at bar closure. Its zero repaint technology means the long and short signals you see on the 5-minute or 15-minute chart are the same signals that were there when the bar closed. No rewriting history. Over 2,000 traders use Quantlogicx across stocks, forex, and cryptocurrency, with individual users recording gains of $8,200 in a single month. Whether you are timing entries on the best buy-sell indicator for your execution timeframe or confirming trend direction on a higher chart, Quantlogicx delivers the signal clarity that multi-timeframe trading demands. See the full indicator suite at Quantlogicx.
FAQ
What is a trading timeframe in day trading?
A trading timeframe is the chart interval that determines how each price bar is formed, such as 1-minute, 5-minute, or daily. Day traders use multiple timeframes simultaneously to separate trend context from trade execution.
What timeframes do most day traders use?
Most day traders use the daily or 4-hour chart for trend bias and the 5-minute or 15-minute chart for trade execution. Beginners are advised to start with the daily plus 5-minute combination to reduce noise.
How is scalping different from day trading in terms of timeframes?
Scalpers trade 10–50+ times daily on 1-second to 5-minute charts, while day traders place 2–10 trades per session using 5-minute and 15-minute charts. Scalping requires near-constant attention and carries higher transaction costs per session.
Why do lower timeframes produce more false signals?
Lower timeframes show more price noise because each bar captures less data, making random fluctuations look like patterns. Higher timeframes smooth out that noise and produce fewer but more statistically reliable signals.
What is the optimal timeframe combination for a beginner day trader?
The daily chart for market bias combined with the 5-minute chart for execution is the recommended starting point for beginners. This two-chart setup reduces cognitive load while maintaining enough structure to identify quality setups.