

Confirming buy and sell signals is defined as the process of validating a trade trigger using multiple independent technical indicators before entering or exiting a position. Traders who rely on a single indicator succeed at a 45–52% rate, while those who apply three independent confirmations reach a 65–73% success rate. That gap represents the difference between guessing and trading with an edge. This guide walks you through how to confirm buy sell signals using indicator categories, timeframe alignment, and a structured step-by-step method that removes emotion from the equation.
How to confirm buy sell signals: indicator categories that matter
The first step in confirming trading signals is understanding that not all indicators measure the same thing. Indicators fall into four distinct categories: trend, momentum, volume, and price action. Each category reads a different dimension of the market.
- Trend indicators (Moving Averages, MACD) show the direction of price over time. They tell you whether the market is moving up, down, or sideways.
- Momentum indicators (RSI, Stochastic) measure the speed of price movement. They identify when a move is gaining or losing strength.
- Volume indicators (OBV, Volume Profile) track participation. They confirm whether buyers or sellers are backing a price move with real conviction.
- Price action (candlestick patterns, support and resistance levels) reflects raw market behavior. It shows where price has reacted before and where it is likely to react again.
Mixing categories like RSI (momentum), OBV (volume), and a 50-period Moving Average (trend) gives you three uncorrelated perspectives on the same signal. Each one confirms something different. That independence is what makes the confirmation meaningful.
Pairing RSI with Stochastic, on the other hand, tells you the same thing twice. Indicator redundancy does not increase confirmation quality. It creates the illusion of agreement while adding zero new information.

Pro Tip: Build your confirmation stack with one indicator from each category. Trend plus momentum plus volume covers three independent market dimensions and gives you the strongest signal alignment without overlap.
Does timeframe alignment change how you read a signal?
Timeframe alignment is one of the most underused tools in a trader's process. A signal that looks valid on a 15-minute chart can be a trap if the daily chart shows a strong opposing trend. The top-down approach solves this problem directly.
Start with the higher timeframe to define the dominant trend. If the weekly chart shows a clear uptrend, you only look for buy signals on lower timeframes. The intermediate timeframe (daily or 4-hour) identifies patterns and setups. The lower timeframe (15-minute or 1-hour) gives you the precise entry point.
Signal validity also depends on your trading style. Day trades carry a signal window of 4–8 hours. Swing trades stay valid for 24–48 hours. Position trades hold relevance for 5–10 days. Acting on a day-trade signal 12 hours after it fires is acting on stale data.
Market context adds another layer. Signals gain reliability when they appear at major support levels, resistance zones, key moving averages, or Volume Profile value areas. A buy signal firing in the middle of a range with no structural backing is far weaker than the same signal appearing at a tested support level.
- A bullish RSI crossover at a 200-day Moving Average support carries far more weight than the same crossover in open air.
- A bearish MACD signal at a well-established resistance zone is a high-probability short setup.
- A breakout signal backed by rising OBV at a prior consolidation zone confirms genuine participation.
Pro Tip: Before acting on any signal, check the next two timeframes above your entry chart. If both show the same directional bias, your confirmation is solid. If they conflict, wait.
What is the step-by-step method for validating buy sell indicators?
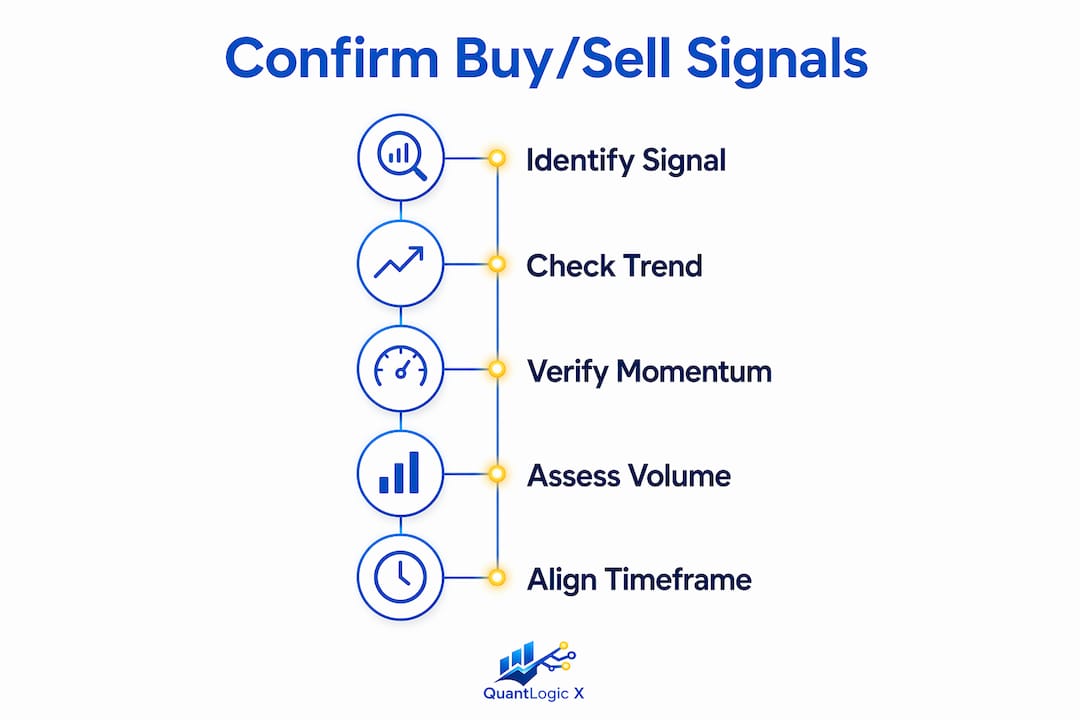
A structured workflow removes the guesswork from signal confirmation. Follow these steps every time before executing a trade.
- Identify the signal. Note the indicator that fired, the timeframe, and the direction (long or short). Check whether it aligns with what you see on a reliable trade signal framework.
- Check multi-indicator alignment. Pull up one trend indicator, one momentum indicator, and one volume indicator. All three should agree on direction. Two out of three is borderline. One out of three is not a trade.
- Verify volume participation. A price move without volume is suspect. OBV rising alongside a buy signal confirms buyers are active. Flat or falling OBV on a breakout is a warning.
- Confirm timeframe confluence. Apply the top-down approach. The higher timeframe trend must not oppose your signal. If it does, the trade carries significantly higher risk.
- Assess risk parameters before entry. Define your stop-loss level and maximum position size before you click buy or sell. Treating alerts as mini-trade plans that include trigger, timeframe, action, stop-loss, and position size reduces decision pressure at the moment of execution.
- Check for invalidation levels. Identify the price level that would prove the signal wrong. If price reaches that level before your target, exit without hesitation.
| Step | Criteria | Pass or Abandon |
|---|---|---|
| Signal identified | Indicator fired with clear direction | Pass if confirmed |
| Multi-indicator alignment | 2–3 categories agree | Pass if 2+ agree |
| Volume confirmation | OBV or volume supports the move | Pass if rising |
| Timeframe confluence | Higher timeframe trend aligns | Pass if no conflict |
| Risk parameters set | Stop-loss and position size defined | Pass if defined |
| Invalidation level clear | Exit price identified in advance | Pass if set |
Pro Tip: Write your confirmation checklist on a sticky note next to your monitor. Running through it physically before every trade builds the habit faster than any mental checklist.
What are the most common mistakes when analyzing buy sell signals?
Most confirmation errors come from a small set of repeatable mistakes. Recognizing them is the fastest way to stop making them.
- Indicator redundancy. Using RSI and Stochastic together feels like double confirmation. It is not. Both measure momentum. They will almost always agree, which creates false confidence rather than genuine validation.
- Ignoring the higher timeframe trend. An oversold RSI on the daily chart looks like a buy opportunity. If the weekly chart shows a strong downtrend, that RSI signal is a trap. Mean-reversion signals without higher timeframe alignment produce some of the most painful losses in trading.
- Waiting for too many confirmations. Four or five confirmations sound safer than three. In practice, they delay entry past the optimal point. By the time every indicator agrees, the move is often halfway done.
- Treating alerts as immediate orders. Alerts are triggers for a verification process, not commands to buy or sell instantly. Acting the moment an alert fires, without checking timeframe alignment and risk, is how traders get caught in false breakouts.
- Ignoring invalidation levels. Entering a trade without a defined exit for being wrong turns a bad signal into a large loss. Every trade needs a price level that proves the thesis incorrect.
"Market context is the ultimate filter for signal reliability. Without confluence at key structural levels, even textbook signals are just noise." Combining Price Action and Indicators for Signal Confirmation
Key Takeaways
Confirming buy and sell signals requires combining independent indicators across trend, momentum, and volume categories, aligning signals with higher timeframe trends, and defining risk parameters before every trade.
| Point | Details |
|---|---|
| Use independent indicator categories | Combine trend, momentum, and volume indicators to get three uncorrelated confirmations. |
| Three confirmations hit 65–73% success | Single-indicator trades succeed at 45–52%; adding two more independent signals closes the gap. |
| Timeframe alignment is non-negotiable | Always check the next two higher timeframes before acting on any signal. |
| Alerts trigger verification, not execution | Treat every alert as a prompt to run your checklist, not as an order to trade immediately. |
| Define invalidation before entry | Set a stop-loss and exit level before you enter so emotion does not drive the decision to exit. |
Why I stopped chasing confirmations and started filtering for quality
Most traders I have worked with make the same mistake early on. They add more indicators, thinking more data means more certainty. What they get instead is analysis paralysis and contradictory signals that cancel each other out.
The shift that actually improved my results was moving from quantity to quality. Three indicators from different categories, aligned with the higher timeframe trend, and appearing at a key structural level. That combination does more work than six indicators from the same analytical family.
The other thing I stopped doing was treating every alert as urgent. Preplanned trade alerts define entry and exit parameters in advance, which removes the emotional spike that comes with a notification. When the alert fires, I already know what I am looking for. That calm is worth more than any indicator.
The traders who confirm signals well are not the ones with the most tools. They are the ones who know exactly what they need to see before they act, and they have the discipline to wait for it. If you want to read trading signals effectively, start with fewer indicators and sharper criteria, not more of both.
— Tran
Quantlogicx makes signal confirmation faster and more reliable
Traders who want a confirmation process built into their charts, rather than assembled manually, use the Quantlogicx TradingView indicator. The tool generates long and short signals using zero repaint technology, meaning every signal is locked at bar close and does not shift after the fact.
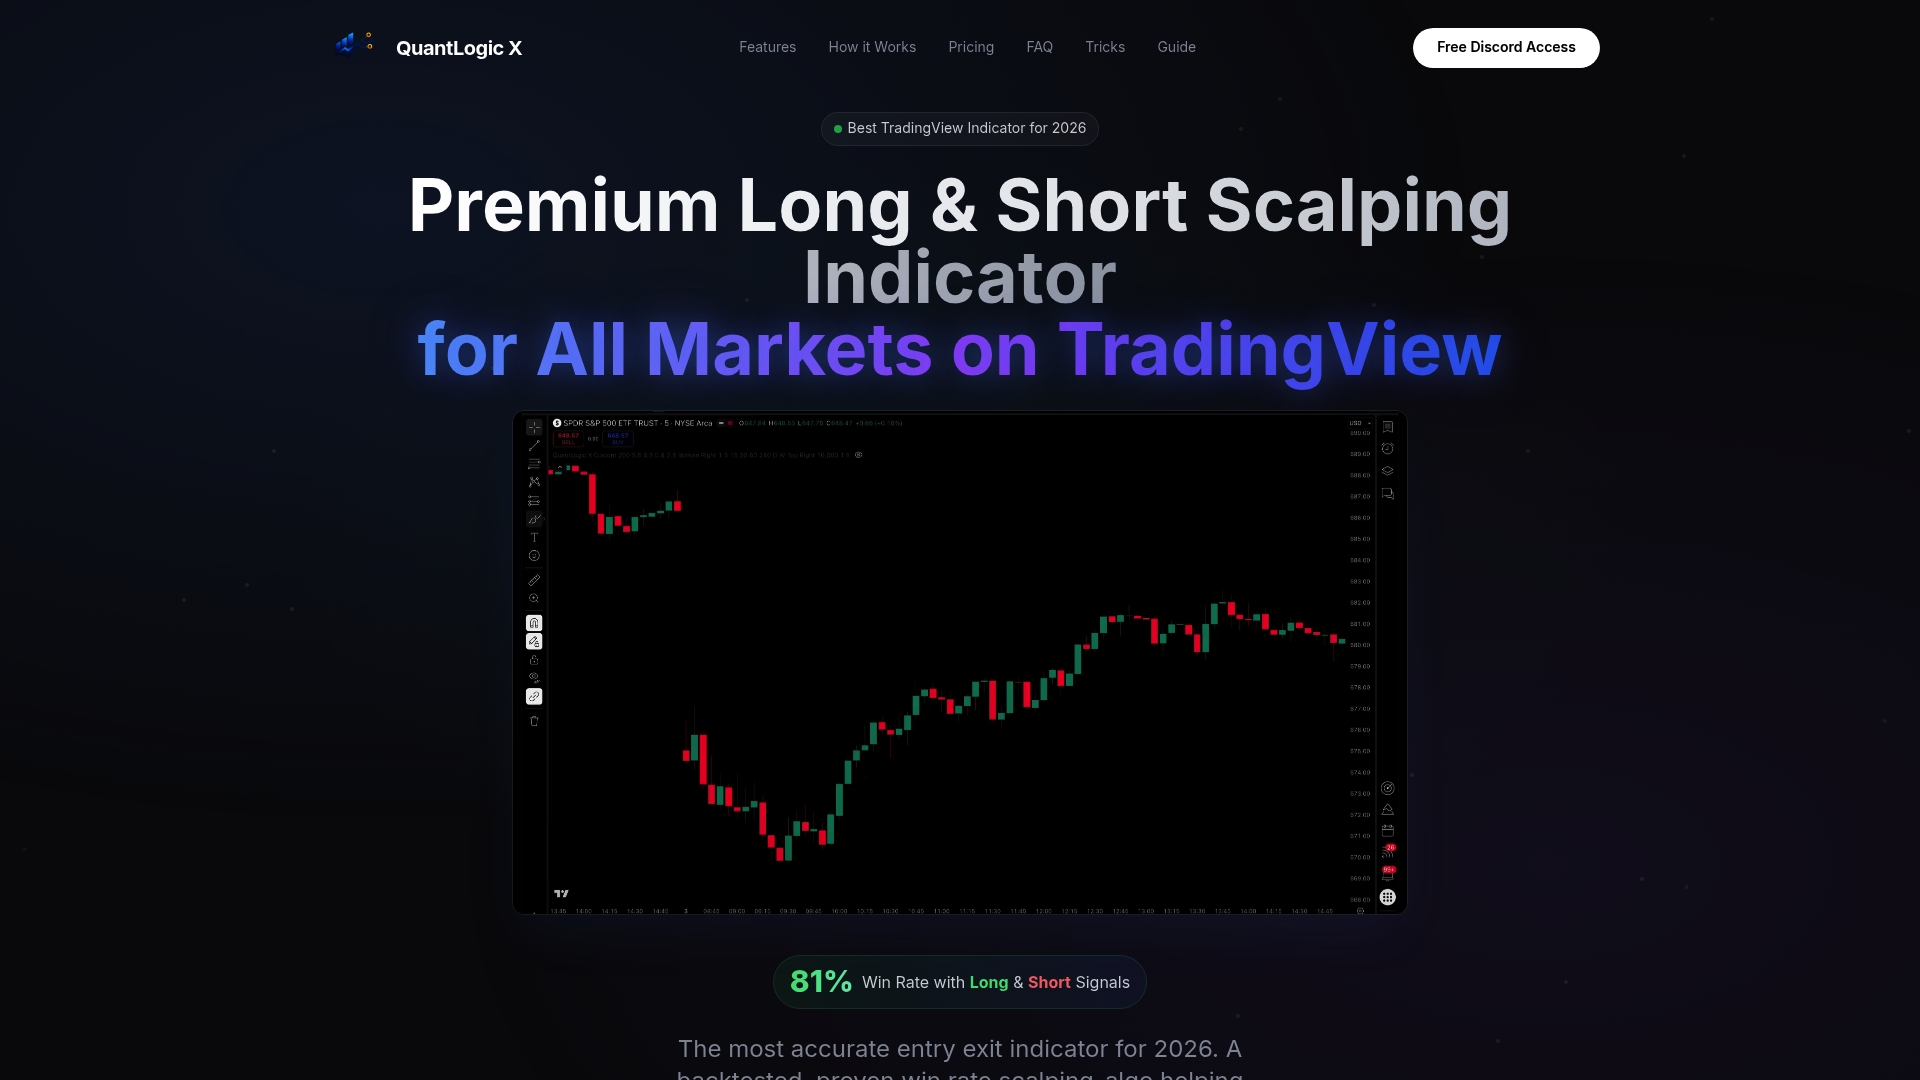
Quantlogicx integrates multi-factor confirmation into a single indicator, combining trend, momentum, and volume analysis so you see a clean buy or sell signal only when the criteria align. Over 2,000 traders across stocks, forex, and cryptocurrency use it, with individual users reporting gains of $8,200 within a single month. Real-time alerts notify you the moment a confirmed signal fires, giving you time to run your checklist before the window closes. Access the Quantlogicx TradingView indicator to see how it fits your trading setup.
FAQ
What does confirming a buy sell signal mean?
Confirming a buy or sell signal means validating a trade trigger with multiple independent indicators before executing. The goal is to reduce false signals and improve the probability that the trade moves in your favor.
How many indicators do you need to confirm a signal?
Three indicators from different categories (trend, momentum, and volume) produce a 65–73% success rate. Using only one indicator drops that rate to 45–52%.
Why does timeframe alignment matter for signal confirmation?
A signal on a lower timeframe can be a false entry if the higher timeframe trend opposes it. Aligning your signal with the dominant trend on the next two higher timeframes filters out the majority of traps.
What is indicator redundancy and why should you avoid it?
Indicator redundancy occurs when two indicators from the same category (such as RSI and Stochastic) are used together. They measure the same market dimension and add no independent confirmation, creating false confidence instead.
How long is a buy sell signal valid after it fires?
Signal validity depends on your trading style. Day trade signals stay valid for 4–8 hours, swing trade signals for 24–48 hours, and position trade signals for 5–10 days. Acting outside these windows means trading on outdated information.