

A buy or sell signal is a condition-based alert generated by a trading strategy or algorithm that tells you exactly when to enter or exit a position. These signals are not guesses. They are defined sets of rules triggered at specific moments, with a clear direction and timing attached. Whether you are scalping forex on a 5-minute chart or swing trading stocks on a daily chart, understanding what does buy and sell signal mean is the foundation of every repeatable trading decision. Tools like RSI, moving averages, and MACD all generate these signals through fixed, testable logic.
What does buy and sell signal mean in technical trading?
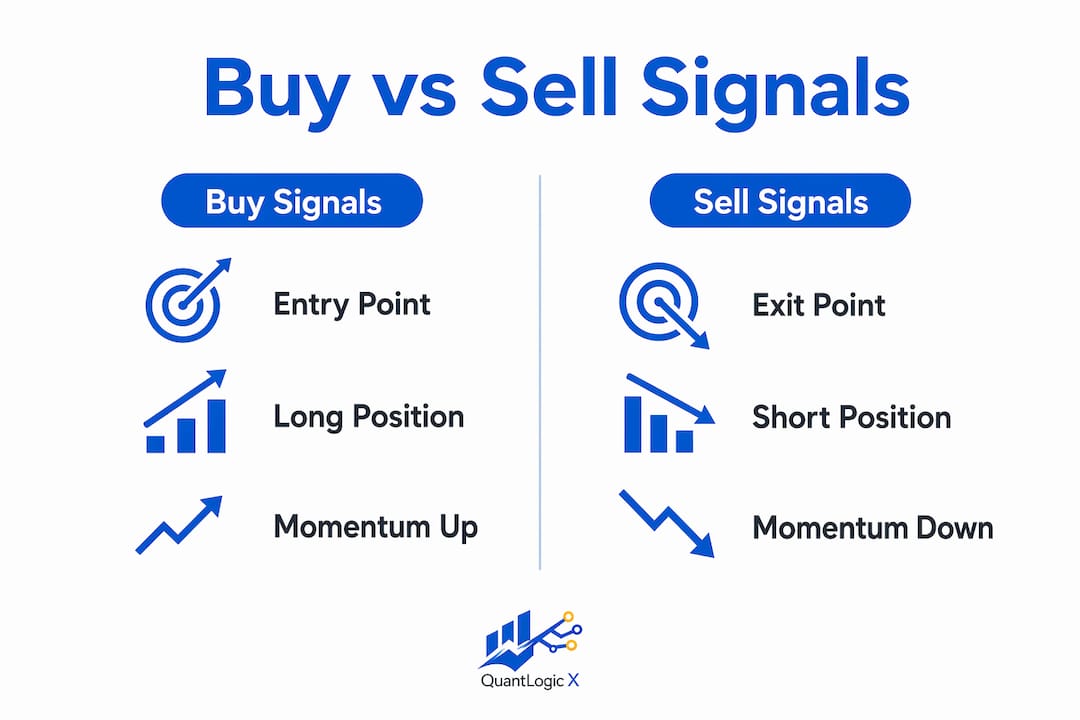
A buy signal tells a trader to open a long position. A sell signal tells a trader to close that position or open a short one. Both are produced by rule-based indicator conditions rather than intuition or opinion.
Trading signals provide structure and discipline by focusing decisions on specific condition-based triggers. That structure is what separates systematic traders from those who react emotionally to price movement. A signal removes the question "should I trade now?" and replaces it with a clear yes or no based on predefined criteria.

Signals can come from human chart reading or from automated algorithms. Both produce similar trigger events, but algorithms execute faster and remove emotional bias from the equation. For traders learning how to read trading signals, the key is understanding that every signal has a source, a condition, and a direction.
Which technical indicators generate buy and sell signals?
The most widely used buy and sell indicators each measure a different aspect of price behavior. Understanding how each one generates a signal helps you choose the right tool for your trading style.
| Indicator | Buy signal condition | Sell signal condition |
|---|---|---|
| Moving average crossover | Short-term MA crosses above long-term MA | Short-term MA crosses below long-term MA |
| RSI | RSI drops below 30 (oversold) | RSI rises above 70 (overbought) |
| MACD | MACD line crosses above signal line | MACD line crosses below signal line |
| Breakout | Price closes above resistance with volume | Price closes below support with volume |
The moving average crossover is one of the clearest buy and sell signal examples. When a 9-period MA crosses above a 21-period MA, that is a golden cross buy signal. It tells you that short-term momentum is outpacing the longer trend, which often precedes a sustained move higher.
RSI works differently. When RSI falls below 30, the asset is considered oversold, and a bounce becomes statistically more likely. When RSI climbs above 70, the asset is overbought and a pullback is probable. These thresholds are not magic numbers. They are reference points that have shown consistent behavior across many markets and timeframes.
MACD combines trend and momentum into one indicator. A bullish crossover of the MACD line above the signal line is a buy trigger. A bearish crossover is a sell trigger. Breakout signals add a third dimension: volume confirmation. A price move above resistance without volume is a weak signal. The same move with strong volume is a high-quality entry.
Pro Tip: Never rely on a single indicator to generate your signals. Combine at least two, such as a moving average crossover confirmed by RSI above 50, to filter out weak setups.
Are buy and sell signals guaranteed to work?
Buy and sell signals are probabilistic, not guaranteed. Every signal carries inherent market risk. A signal that works 70% of the time still fails 30% of the time, and those losses are a normal part of any systematic approach.
The biggest mistake traders make is treating a signal as a certainty. When a trade fails, they blame the indicator rather than their expectation. Traders must accept normal losing streaks rather than assuming signal failure every time a trade goes against them.
Confirmation is the practical solution to this problem. Experienced traders treat indicator crossovers as hypotheses that need supporting evidence before acting. The same RSI or moving average rule behaves very differently in a trending market versus a choppy, sideways one.
Common pitfalls when interpreting buy and sell signals:
- Acting on a single indicator without any confirmation
- Ignoring the broader market trend when a signal fires
- Using the same signal settings across all markets without testing
- Treating every signal as equal regardless of market context
- Abandoning a signal system after a short losing streak
Pro Tip: Before trading any signal live, test it across at least 100 historical trades in the specific market and timeframe you plan to use. A signal that works on EUR/USD may fail on a low-volume stock.
How does timeframe affect the meaning of buy and sell signals?
Timeframe is one of the most misunderstood factors in buy and sell signal strategies. A buy signal on a 5-minute chart is not the same as a buy signal on a daily chart. The 5-minute signal reflects short-term noise. The daily signal reflects a structural shift in market behavior.
Lower timeframes produce more signals, but those signals are noisier and more prone to false triggers. Higher timeframes produce fewer signals, but each one carries more weight because it reflects a broader consensus of market participants.
Aligning your signal timeframe with your trading style is not optional. It is the difference between a system that fits your schedule and one that creates constant stress.
- Scalpers use 1-minute to 15-minute charts. Signals fire frequently. Speed and discipline matter most.
- Day traders use 15-minute to 1-hour charts. Signals are fewer but more reliable within a single session.
- Swing traders use 4-hour to daily charts. Signals develop over days and require patience to hold through normal pullbacks.
- Position traders use weekly charts. Signals are rare but carry the highest conviction.
A practical method for improving signal quality is multi-timeframe confirmation. If the daily chart shows a bullish trend and the 1-hour chart generates a buy signal in the same direction, that alignment significantly increases the probability of a successful trade.
How do buy and sell signals fit into a full trading strategy?
A signal is a component of a trading strategy, not a complete strategy by itself. Without connected stops and targets, signals become decorations on a chart rather than tools for real decisions.
Every signal must connect to three things: an entry, a stop loss, and a profit target. The entry defines exactly how you get into the trade, whether by market order at the signal bar close or by limit order at a retracement level. The stop loss defines the point at which the trade idea is wrong. The profit target defines where you take your money off the table.
A full trade definition includes entry type, stop loss invalidation logic, and profit targets consistent with the trading timeframe. Without these parameters, you cannot backtest a signal reliably or execute it with confidence.
A practical signal-based trade plan follows this sequence:
- Identify the signal. Wait for the indicator condition to be fully met at bar close. Never act on a signal that has not confirmed.
- Check the context. Confirm the signal aligns with the higher timeframe trend. A buy signal against a strong downtrend is a low-probability trade.
- Define the entry. Decide whether you enter at market or wait for a pullback to a specific level.
- Set the stop loss. Place the stop below the most recent swing low for a buy signal, or above the swing high for a sell signal.
- Set the profit target. Use a fixed risk-to-reward ratio of at least 1:2, or target the next major resistance or support level.
- Size the position. Risk no more than 1–2% of your account on any single trade, regardless of how strong the signal looks.
Pro Tip: Log every trade with the signal that triggered it, the timeframe, and the outcome. After 50 trades, patterns in your win rate and average risk-to-reward will tell you more than any indicator setting ever could.
Signals are most useful when they form part of a coherent trading workflow rather than standalone arrows on a chart. The workflow is what turns a signal into a decision, and a decision into a result you can measure and improve.
Key Takeaways
Buy and sell signals are condition-based alerts that require confirmation, timeframe alignment, and a full trade plan to generate consistent, measurable results.
| Point | Details |
|---|---|
| Signals are rule-based | Every buy or sell signal comes from a defined condition, not a guess or opinion. |
| Signals are probabilistic | No signal guarantees a winning trade; losing streaks are a normal part of any system. |
| Confirmation reduces false signals | Combining two or more indicators filters weak setups and improves signal quality. |
| Timeframe shapes signal meaning | A buy signal on a 5-minute chart carries far less weight than the same signal on a daily chart. |
| Signals need a full trade plan | Entry, stop loss, and profit target must be defined before acting on any signal. |
What I have learned from years of watching traders misuse signals
The most common mistake I see is treating a signal as the end of the analysis rather than the beginning. A trader spots a golden cross on a 15-minute chart and buys immediately, without checking whether the daily trend supports the move or whether volume confirms the breakout. The signal fired. The trade failed. The trader blames the indicator.
Signals do not fail in isolation. They fail because the context around them was ignored. I have watched traders abandon perfectly valid systems after three consecutive losses, only to see those systems produce strong results in the following weeks. The problem was never the signal. It was the expectation that signals should win every time.
The traders who use signals well share one habit: they test before they trust. They run their chosen indicator across hundreds of historical setups in the specific market they trade. They know their system's win rate, average winner, and average loser before they risk a dollar. That knowledge is what lets them hold through a losing streak without panic.
Combining quantitative signals with discretionary judgment is not a weakness. It is a skill. A signal tells you when conditions are met. Your judgment tells you whether the broader context makes that signal worth acting on. Both matter.
— Tran
Quantlogicx: a TradingView indicator built around clear signals
Quantlogicx built its TradingView indicator specifically to address the gap between seeing a signal and knowing what to do with it. The tool uses zero repaint technology, meaning every long and short signal locks in at bar close and does not change retroactively.
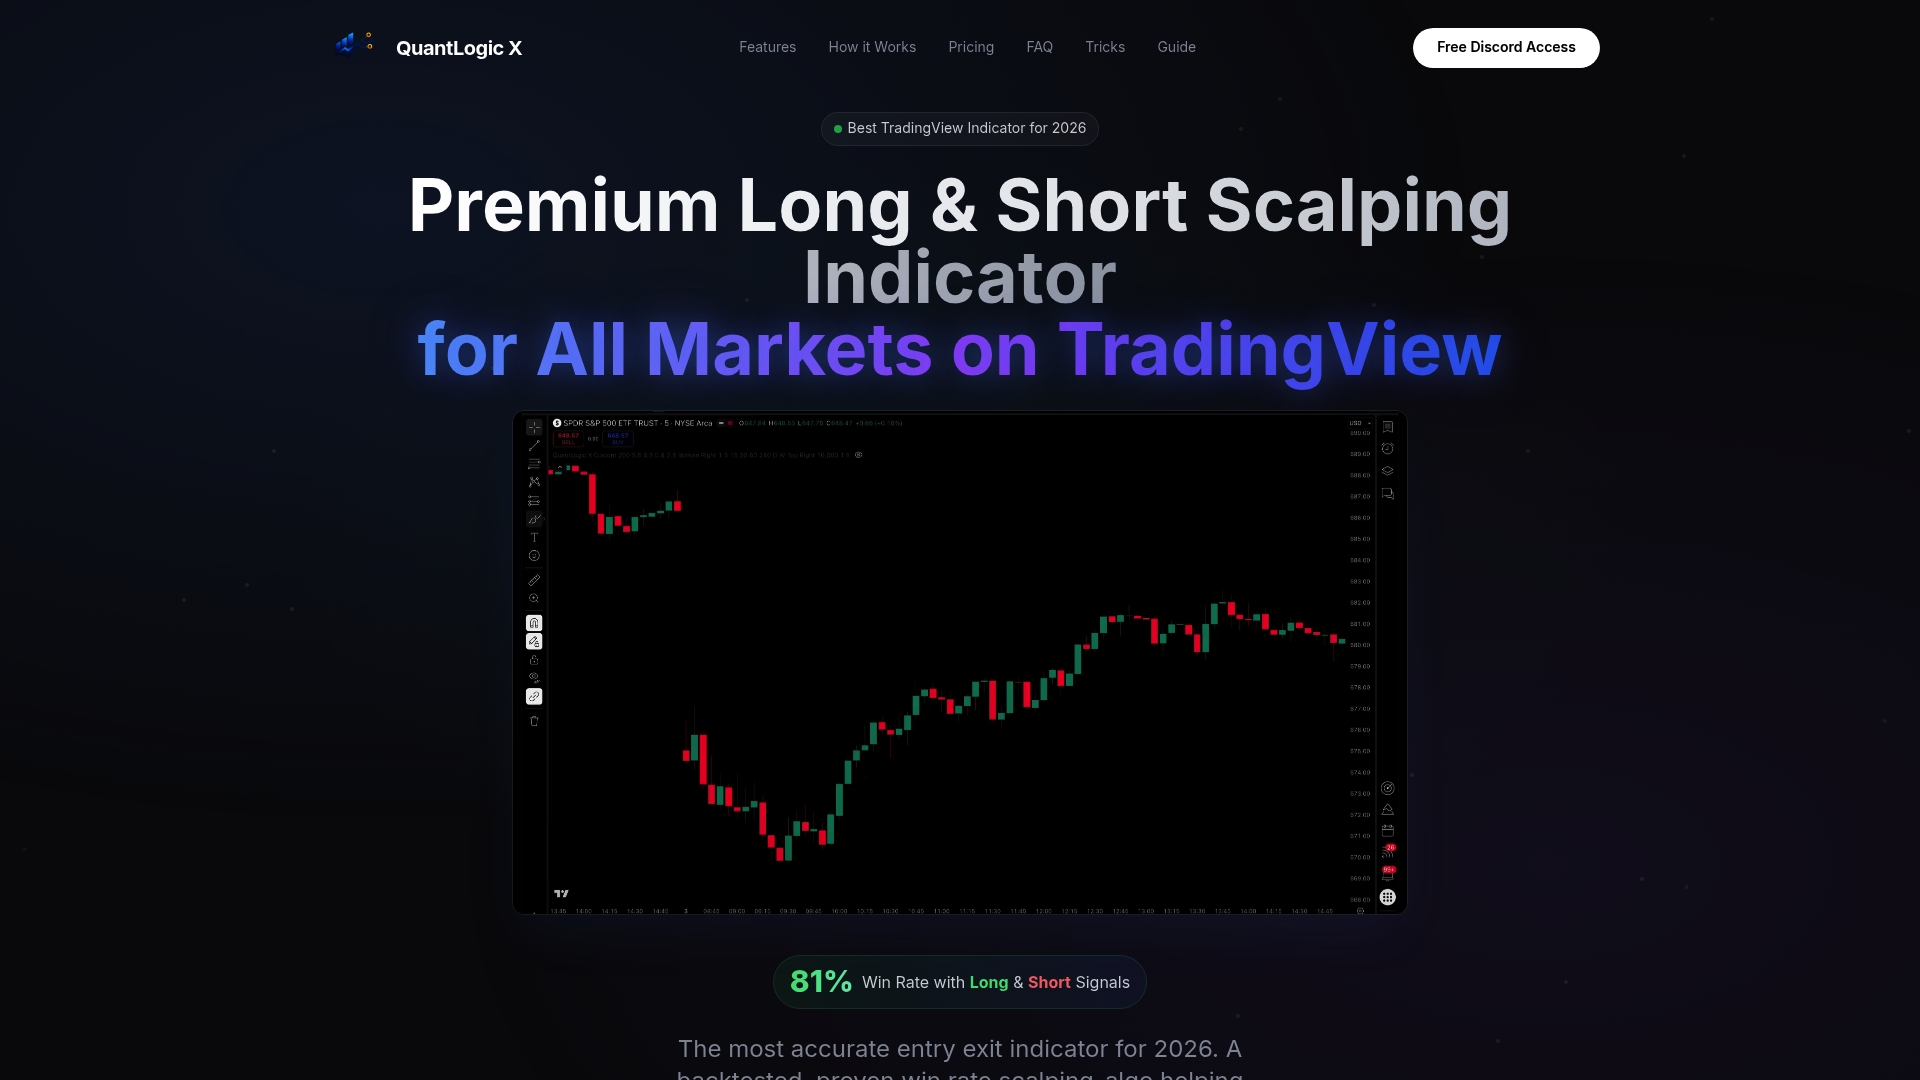
Over 2,000 traders use the Quantlogicx algorithm across stocks, forex, and cryptocurrency. The indicator reports an 81% win rate and includes real-time alerts so you never miss a signal. One user recorded $8,200 in gains within a single month. For traders who want reliable buy and sell signals without rebuilding their entire approach, Quantlogicx connects signal generation directly to entry, stop, and target logic. You can also explore how it applies to scalping on SPY for a concrete example of signals in action.
FAQ
What is a buy signal in trading?
A buy signal is a condition-based alert generated by a trading indicator or algorithm indicating that conditions favor entering a long position. Common examples include RSI dropping below 30 or a short-term moving average crossing above a long-term one.
What is a sell signal in trading?
A sell signal indicates that conditions favor closing a long position or entering a short one. RSI rising above 70 or a bearish moving average crossover are standard sell signal triggers.
Are buy and sell signals always accurate?
No. Buy and sell signals are probabilistic indicators, not guarantees. Every signal carries market risk, and even high-quality systems produce losing trades as a normal part of their performance.
How do I confirm a buy or sell signal?
Confirmation means checking that at least two independent indicators agree before acting. For example, a bullish moving average crossover confirmed by RSI above 50 and a higher timeframe uptrend is a stronger setup than any single trigger alone.
What timeframe should I use for trading signals?
The right timeframe depends on your trading style. Scalpers use 1-minute to 15-minute charts, day traders use 15-minute to 1-hour charts, and swing traders use 4-hour to daily charts. Aligning your signal timeframe with your goals is critical for consistent results.