

The best scalping timeframe setup uses three charts working together: the 15-minute for market context, the 5-minute for signal confirmation, and the 1-minute for precise entry. That three-chart hierarchy is the foundation most experienced scalpers return to, regardless of asset class or session.
Here is how each layer works:
- 15-minute (context): Defines session bias, identifies key intraday pivot points, and tells you whether the market is trending or ranging before you touch a single trade.
- 5-minute (signal): Filters out the noise of the 1-minute chart while staying sensitive enough to capture short-term momentum. This is where you identify the setup, not where you pull the trigger.
- 1-minute (execution): Pinpoints the exact entry, stop placement, and exit timing. Every decision here is informed by what the two higher charts already confirmed.
The spacing between these charts follows a 4–6x ratio between adjacent timeframes, which keeps each chart showing genuinely different information rather than near-duplicate patterns. Three is the right number: fewer and you lose directional context; more and you accumulate contradictions faster than insights.
Pro Tip: Never stack timeframes closer than a 3x ratio. A 1-minute and 2-minute chart show essentially the same price action with different bar counts. Use 1-minute, 5-minute, and 15-minute for orthogonal, non-redundant layers.
Why timeframe choice makes or breaks your scalping strategy
Scalping targets small, frequent price moves. Trades typically last anywhere from 10 to 180 seconds, sometimes stretching to 10 minutes, and profits per trade are measured in pips or cents rather than dollars. That narrow margin means every structural decision compounds quickly, and timeframe selection sits at the top of that list.
Choose a timeframe that is too fast and you are trading noise, not price action. Choose one that is too slow and you miss entries entirely. The 1-minute chart offers the most opportunities per session but also the most false signals. The 5-minute chart gives you cleaner structure at the cost of fewer setups. The 15-minute chart is not an entry chart at all; it is a bias chart.
Market sessions add another layer. Liquidity peaks during the London open (08:00–17:00 GMT/BST) and New York open (13:00–22:00 GMT/BST), and the 1-minute chart behaves predictably during those windows. During the Asian session, low volatility turns the 1-minute chart choppy and unreliable, making the 5-minute a better execution frame for that period.
Psychologically, scalping demands a level of focus that most traders underestimate. The faster the timeframe, the more decisions per hour, and the more emotional pressure per decision. Timeframe choice is not just a technical question; it is a question of what you can actually sustain.
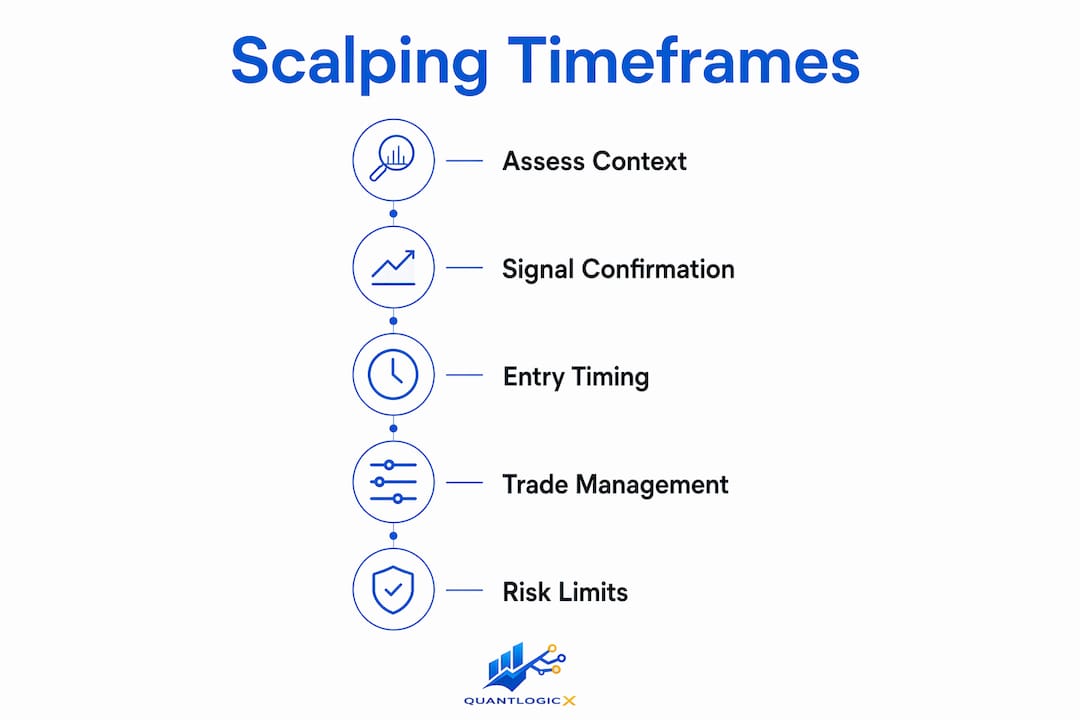
How the 1-minute, 5-minute, and 15-minute charts compare
Each of the three core scalping timeframes has a distinct role, and using them interchangeably is one of the fastest ways to blow up a session.

The 1-minute chart offers the highest trade frequency but also the highest noise. Scalpers typically execute here with stop losses kept tight. It is best suited for experienced traders with low-latency connections and brokers offering tight spreads. During the New York/London overlap, the 1-minute chart behaves predictably enough to be the primary execution frame.
The 5-minute chart is the most popular scalping timeframe for good reason. It balances signal reliability with trade frequency, smooths out erratic 1-minute wicks, and provides a reliable structure for Fibonacci retracements and trendlines. Scalpers using the 5-minute as their signal chart typically have moderate pip targets with moderate stop losses. It is also the preferred execution frame during the Asian session when the 1-minute becomes too choppy.
The 15-minute chart is the reality check. It identifies session bias, highlights key intraday pivot points, and tells you whether a breakout on the lower frames has macro support behind it. A breakout on the 15-minute chart often leads to a run of multiple profitable scalps on the 1-minute. But you never enter directly from it.
| Timeframe | Role | Pip Target | Stop Loss Range | Best Session |
|---|---|---|---|---|
| 1-minute | Execution | ~5 pips | Tight (2–3 pips) | London/NY overlap |
| 5-minute | Signal | ~10 pips | 5–7 pips | All sessions |
| 15-minute | Context/bias | N/A (no entries) | N/A | Pre-session review |
How multi-timeframe analysis sharpens your entry timing
The three-chart framework is not just about having more information. It is about having the right information at each decision point, in the right order.
Start with the 15-minute chart before the session opens. Mark key horizontal support and resistance levels. Note whether the market is trending or ranging. That bias governs every trade you consider for the next hour. Drop to the 5-minute chart and confirm the micro-trend direction. If the 15-minute shows a bullish bias and the 5-minute is making higher highs and higher lows, you only look for long setups on the 1-minute. The signal timeframe is where you identify specific entry conditions; the execution timeframe is where you time the trigger.
On the 1-minute chart, wait for a pullback into a structural level identified on the higher frames, then look for your entry confirmation: a market structure shift, a candlestick reversal pattern, or an EMA crossover. Place a limit order at a specific price rather than entering at market. Your stop goes one pip beyond the most recent swing point.
Pro Tip: After you enter a trade, stop watching the 1-minute chart obsessively. Manage the position on the 5-minute chart. Execution-timeframe noise after entry is one of the most common causes of premature exits on perfectly valid setups.
The 3–5x multiplier rule between adjacent timeframes is what makes this work. A 1-minute entry uses the 5-minute for direction. A 5-minute entry uses the 15-minute for direction. Tighter spacing produces redundant signals; wider spacing creates structural gaps where mid-timeframe context goes missing.
What factors should actually drive your timeframe choice?
The 1-minute/5-minute/15-minute stack is the default, but several variables push traders toward adjustments.
- Experience level: Beginners struggle with the 1-minute chart because the decision window is too short. Starting on the 5-minute as the primary execution frame and using the 15-minute for context is a more forgiving entry point into scalping.
- Market volatility: High-volatility sessions favor tighter timeframes. Low-volatility sessions, like the Asian session in forex, often require moving up one frame to avoid false signals.
- Asset class: Forex pairs like EUR/USD work well on the 1-minute during overlap sessions. Futures traders (ES, NQ) often prefer tick-based charts over time-based ones. Stock scalpers frequently find the 2-minute chart more effective than the 1-minute due to slower relative movement, using the 10-minute for direction.
- Broker spread and execution speed: If your spread exceeds one-third of your profit target, the trade is unfeasible regardless of timeframe. A 5-pip spread on a 5-pip target is not a scalp; it is a donation. Platform latency compounds this: a 500-millisecond delay on a 1-minute chart can mean the entire move has already happened before your order fills.
- Risk tolerance: Tighter timeframes require tighter stops, which means more frequent stop-outs even on winning strategies. Traders with lower psychological tolerance for consecutive losses often find the 5-minute signal frame more sustainable.
Practical risk management for scalpers choosing their timeframe
Risk management in scalping is not optional. The speed of the style means losses compound as fast as gains.

Set your pip target and trade duration to match the timeframe you are actually using. A 1-minute scalper targeting 5 pips needs a stop of 2–3 pips maximum to maintain a viable risk-to-reward ratio. A 5-minute scalper targeting 10 pips can afford a 5–7 pip stop. Mismatching these numbers is how scalpers turn small losses into session-ending drawdowns.
Start with one market, one session, and one setup. The London open on EUR/USD is the most commonly recommended starting point: tight spreads, predictable volatility, and a clear session structure. Add complexity only after you have 20 trades of documented results on that single setup.
Scalping requires 60–120 minutes of uninterrupted focus per session. If you cannot protect that window, your execution quality drops and overtrading fills the gap. The London/New York overlap is the highest-liquidity window for most forex pairs, and it is where the 1-minute chart is most reliable. Outside that window, consider moving up to the 5-minute as your execution frame or stepping away entirely.
A realistic starting risk rule is 0.25% of capital per scalp with a daily maximum loss cap of 1–2%. That keeps a bad session from becoming a blown account.
What advanced research says about timeframe selection
The three-timeframe framework is not just practitioner wisdom. Observational data from retail trading configurations consistently points to three as the sweet spot for multi-timeframe analysis. Single-timeframe analysis produces context-blind signals. Two timeframes provide partial alignment but miss execution timing precision. Four or more timeframes produce contradictions across at least two or three pairs continuously, slowing decisions and creating what practitioners call reconciliation paralysis.
Structural alignment across timeframes is where the real edge lives. Using Fibonacci retracements defined on the 5-minute chart for entries on the 1-minute, for example, produces higher-probability setups than entries taken without that structural anchor. The 15-minute chart shows approximately 55–60% predictive accuracy for daily price direction in trending markets, but that accuracy is useless for actual entries. The scalper's edge comes from harmonizing the frames, not from picking one "best" chart.
During high-impact news releases like FOMC, NFP, or CPI, 1-minute and 5-minute charts become unreliable. Time-based candles create massive gaps and price spikes that stop out positions instantly. Experienced scalpers shift to tick or volume-based charts during these events, or simply step aside.
Pro Tip: During your session, keep only your three designated charts open. Every additional chart you open mid-session is a source of conflicting signals, not additional clarity. Discipline about what you look at is as important as discipline about what you trade.
Platform quality matters more than most retail traders acknowledge. A platform with slow data feeds or unreliable order routing undermines every timeframe decision you make. The 1-minute chart is only as good as the data populating it.
Common mistakes when choosing scalping timeframes
Most scalping failures trace back to a handful of repeatable errors.
Using too many timeframes is the most common. Checking the 1-minute, 2-minute, 3-minute, 5-minute, and 15-minute simultaneously creates analysis paralysis. Three charts, with proper spacing, is the ceiling.
Stacking timeframes too close together is the second. A 1-minute and 2-minute chart show essentially the same price action. The 4–6x spacing rule exists precisely to prevent this. Adjacent charts need to show genuinely different structural information.
Switching timeframes mid-session destroys consistency. If you start a session on the 1-minute execution frame and switch to the 5-minute because the 1-minute "looks choppy," you are reacting to noise rather than following a plan. Constantly switching timeframes mid-session is one of the clearest documented paths to failure.
Ignoring the spread relative to the profit target. The timeframe does not matter if the broker is consuming the profit. Always check the bid/ask spread before placing a scalp on the 1-minute or 30-second chart.
Trading the 1-minute during low-liquidity sessions. The Asian session turns the 1-minute chart into a false-signal generator for most major forex pairs. The fix is simple: move up to the 5-minute as the execution frame, or avoid trading that session entirely until you have a strategy specifically designed for it.
Treating the 1-minute chart as random. The 1-minute chart is a direct representation of order flow. If you cannot identify clear support and resistance on it, the problem is usually insufficient preparation on the higher timeframes, not the chart itself.
How to backtest and validate your scalping timeframe setup
Backtesting a scalping timeframe setup requires a different approach than backtesting a swing strategy. The data resolution matters enormously.
Start by selecting a single market and a single session window. EUR/USD during the London open is the standard benchmark because the data is clean, the spreads are tight, and the session has a defined start and end. Pull at least three months of 1-minute historical data and mark your 15-minute bias levels before reviewing any 1-minute entries.
Walk through the data manually, chart by chart, applying your three-timeframe rules in sequence: 15-minute bias first, 5-minute signal confirmation second, 1-minute entry trigger third. Log every qualifying setup, whether you would have taken it or not. Track the entry price, stop level, target, and outcome. After 50 logged setups, calculate your win rate, average win, and average loss.
Pay specific attention to how the setup performs across different session conditions. The same three-timeframe stack that produces clean signals during the London/New York overlap may generate far more noise during the Asian session. That is not a flaw in the framework; it is information about when to apply it.
Validate by forward-testing on a demo account for at least 20 live sessions before committing real capital. The goal is to confirm that your execution matches your backtested rules, not just that the rules work in theory. Execution slippage, emotional pressure, and real-time spread widening all affect live results in ways that historical data cannot fully replicate.
How Quantlogicx removes the guesswork from timeframe execution
Selecting the right timeframe stack is half the battle. Executing on it with precision is the other half, and that is where most retail scalpers lose their edge. Quantlogicx was built specifically to solve that problem.
The Quantlogicx TradingView indicator works across the 1-minute, 5-minute, and 15-minute charts, delivering zero-repaint long and short signals that lock in at bar close. No repainting means the signal you see is the signal that actually fired, which is the only kind worth trading on a 1-minute chart. The algorithm has been adopted by over 2,000 traders across stocks, forex, and cryptocurrency, with documented individual gains of $8,200 in a single month.
Real-time alerts mean you are not staring at the 1-minute chart for hours waiting for a setup. You set your 15-minute context levels, let Quantlogicx monitor the execution frame, and act when the signal fires. For scalpers who want to learn advanced scalping strategy types without rebuilding their entire approach from scratch, the platform's community and alert system provide the structure that most retail traders are missing.
Key Takeaways
The best scalping timeframe setup combines three charts in a 4–6x spacing hierarchy, with each chart serving a distinct role in the decision process.
| Point | Details |
|---|---|
| Three-chart hierarchy | Use 15-minute for context, 5-minute for signal, and 1-minute for execution. |
| Spacing rule | Each adjacent timeframe should be 4–6x the one below to avoid redundant signals. |
| Session timing | The London/New York overlap is the most reliable window for 1-minute scalping. |
| Spread threshold | If the spread exceeds one-third of your profit target, the trade is not viable regardless of timeframe. |
| Focus requirement | Scalping requires 60–120 minutes of uninterrupted focus; protect that window or move to a slower style. |
FAQ
Which timeframe is best for scalping?
The 1-minute chart is the primary execution frame for most scalpers, paired with the 5-minute for signal confirmation and the 15-minute for session bias. The "best" timeframe is ultimately the one that matches your typical holding time and the liquidity conditions of your chosen session.
What is the most successful scalping strategy?
The most consistent scalping approach uses a three-timeframe stack with a 4–6x spacing ratio, trading only in the direction of the 5-minute trend and entering on 1-minute pullbacks to structural levels. Strict stop-loss discipline and trading exclusively during high-liquidity sessions like the London/New York overlap are what separate profitable scalpers from the rest.
Is the 5-minute chart good for scalping?
Yes. The 5-minute chart is the most popular scalping timeframe because it balances signal quality with trade frequency, with typical pip targets around 10 pips and stop losses in the 5–15 pip range. It also functions as a reliable execution frame during low-volatility sessions when the 1-minute chart generates too many false signals.
How many timeframes should a scalper use?
Three is the documented sweet spot: one for context, one for signal, and one for execution. Fewer than three and you lose directional context; more than three and contradictions accumulate faster than useful information, producing decision paralysis rather than clarity.