

Win rate is defined as the percentage of winning trades out of total trades, calculated as (Winning Trades ÷ Total Trades) × 100. Most traders treat it as the primary measure of success. That is a costly mistake. The types of trading win rate metrics that actually matter extend well beyond raw accuracy. They include breakeven win rate, expectancy, profit factor, and win/loss ratio. Each metric tells a different part of the story. Understanding how they interact is what separates traders who grow accounts from those who grind in place.
1. What are the most common types of trading win rate metrics?
The four core win rate metrics are raw win rate, win/loss ratio, breakeven win rate, and expectancy. Each one measures a different dimension of performance, and none of them works well in isolation.
Raw win rate is the simplest. Divide your winning trades by your total trades, then multiply by 100. A trader who wins 60 out of 100 trades has a 60% raw win rate. This number tells you how often you are right, but nothing about how much you make when you are right or lose when you are wrong.

Win/loss ratio compares the number of winning trades to losing trades. A 3:1 win/loss ratio means three wins for every loss. This metric is useful for spotting consistency, but it still ignores the size of each win and loss.
Breakeven win rate is the minimum win rate you need to avoid losing money at a given risk/reward ratio. The formula is 1 ÷ (1 + Risk/Reward Ratio). At a 1:2 risk/reward ratio, your breakeven win rate is 33%. At 1:1, it is 50%. At 1:3, it drops to 25%. This metric is the bridge between accuracy and profitability.
Expectancy is the most complete of the four. The formula is (Win Rate × Average Win) minus (Loss Rate × Average Loss). A positive expectancy means the strategy makes money over time. A negative expectancy means it loses money, regardless of how high the win rate looks.
- Raw win rate: measures accuracy only
- Win/loss ratio: measures frequency balance
- Breakeven win rate: sets the minimum accuracy threshold
- Expectancy: measures actual dollar value per trade
Pro Tip: Require at least 50–100 trades before drawing conclusions from any win rate metric. Smaller sample sizes produce misleading results and can cause you to abandon a working strategy or stick with a broken one.
2. How do win rate metrics relate to profitability?
Win rate reflects accuracy, but risk/reward ratio determines efficiency. A trader with a 70% win rate who risks $2 to make $1 can still lose money over time. A trader with a 40% win rate who risks $1 to make $3 can be consistently profitable. The numbers prove it.
The table below shows how breakeven win rates shift with different risk/reward setups.
| Risk/Reward Ratio | Breakeven Win Rate | What It Means |
|---|---|---|
| 1:1 | 50% | You must win half your trades to break even |
| 1:2 | 33% | Win one in three trades to stay flat |
| 1:3 | 25% | Win one in four trades to stay flat |
| 2:1 | 67% | High accuracy required; small reward per trade |
Profit factor adds another layer. It equals total gross profit divided by total gross loss. A profit factor of 1.5–2.0 signals a solid edge. Below 1.0 means the strategy loses money. Profit factor is easy to calculate and gives a quick read on system health.
Expectancy goes deeper. It is the only metric that tells you the expected dollar return per trade across a large sample. Two strategies with identical win rates can produce completely different outcomes if their average win and loss sizes differ. That is why expectancy is the metric serious traders use to validate a system before scaling it.
Pro Tip: Calculate expectancy before you increase position size. A positive expectancy confirms your edge is real. A negative expectancy means scaling up only accelerates losses.
A common misconception is that a high win rate guarantees profit. A 70% win rate paired with a 0.5:1 risk/reward ratio loses money over time. The math is unforgiving. Win rate and risk/reward must work together, not independently.
3. What are typical win rate benchmarks by trading style?
Win rate benchmarks vary significantly by strategy type. Expecting a trend following system to hit 65% accuracy is unrealistic. Expecting a scalping system to hit 35% is equally off base. Aligning your expectations with your strategy type is a prerequisite for honest performance evaluation.
- Scalping: Win rates of 55–65% are typical. Scalpers take many trades with tight risk/reward ratios, often near 1:1. High frequency and small margins mean accuracy must stay elevated to cover transaction costs.
- Swing trading: Win rates of 40–50% are standard. Swing traders hold positions for days or weeks and target larger moves, which naturally reduces accuracy but increases the size of each win.
- Trend following and breakout trading: Win rates of 30–40% are common. These strategies accept many small losses in exchange for occasional large gains. Experienced traders often run 30–40% win rates paired with 3:1 risk/reward ratios or better.
The key insight is that no benchmark is universally superior. A scalper with a 60% win rate and a trend follower with a 35% win rate can generate identical expectancy if their risk/reward setups are calibrated correctly. The metric that matters is whether your actual win rate clears the breakeven threshold for your specific setup.
Risk/reward ratio works best when it comes from historical trade data rather than guesswork. Basing your ratio on actual past trades lets your win rate align naturally with how your strategy actually performs in the market.
4. How to use win rate metrics to improve your trading strategy
Applying win rate metrics to real decisions requires a structured approach. Raw numbers without context produce bad conclusions.
-
Calculate your breakeven win rate first. Identify your average risk/reward ratio from your last 50–100 trades. Apply the formula 1 ÷ (1 + Risk/Reward Ratio). This number is your floor. If your actual win rate sits below it, the strategy loses money regardless of how it feels.
-
Target a margin above breakeven. Traders should exceed their breakeven win rate by 10–15% to generate profit after transaction costs and slippage. A breakeven rate of 33% means you need a real win rate of at least 43–48% to stay ahead.
-
Use expectancy to validate the system. Calculate (Win Rate × Average Win) minus (Loss Rate × Average Loss) across your full sample. If expectancy is positive, the system has an edge. If it is negative, adjusting the win rate alone will not fix it. You may need to cut losses earlier or let winners run longer.
-
Check profit factor for a quick health read. A profit factor below 1.0 is a red flag regardless of win rate. A reading of 1.5 or above confirms the system generates more than it loses. Use this alongside expectancy, not instead of it.
-
Avoid recency bias in win rate analysis. A five trade winning streak does not validate a strategy. A five trade losing streak does not invalidate one. Expectancy is the only metric worth scaling a strategy around because it accounts for both frequency and magnitude across a statistically meaningful sample.
-
Prioritize risk/reward improvements over win rate chasing. Increasing your risk/reward ratio often has a stronger impact on total profit than forcing your win rate higher. Holding winners longer or cutting losers earlier moves the needle faster than trying to pick more winning trades.
-
Review metrics by market condition. A strategy that produces a 55% win rate in trending markets may drop to 40% in choppy conditions. Segment your performance data by market type to understand where your edge actually lives. You can read more about measuring indicator performance to build a more complete evaluation framework.
Pro Tip: Track your metrics in a trading journal with at least 100 trade entries before making any system changes. Decisions based on fewer trades are statistically unreliable and often lead to over-adjusting a working strategy.
Key Takeaways
Win rate alone does not determine trading success. Expectancy, profit factor, and breakeven win rate together reveal whether a strategy has a real edge.
| Point | Details |
|---|---|
| Win rate measures accuracy only | Raw win rate tells you how often you win, not how much you make. |
| Breakeven win rate sets the floor | Calculate 1 ÷ (1 + Risk/Reward Ratio) to find your minimum required accuracy. |
| Expectancy is the core metric | Positive expectancy confirms a real edge; negative expectancy means the system loses money over time. |
| Strategy type sets the benchmark | Scalping targets 55–65%, swing trading 40–50%, and trend following 30–40% win rates. |
| Profit factor confirms system health | A profit factor of 1.5–2.0 signals a solid edge worth developing further. |
Why I stopped chasing win rate and started watching expectancy
Most traders I have spoken with obsess over win rate because it feels like a report card. A 70% win rate sounds like an A. A 35% win rate sounds like failure. That framing is wrong, and it costs traders real money.
The psychological pull toward high win rates is real. Losing trades feel bad. A strategy that wins often feels good, even when the account balance tells a different story. I have watched traders hold losing positions too long and cut winners too early, all to protect a win rate number that does not actually measure profitability.
The traders who build consistent accounts think differently. They treat win rate as one data point among several. They know their breakeven threshold. They calculate expectancy before scaling. They read about win rate trading indicators to understand how technology can surface these metrics automatically rather than tracking them manually.
The uncomfortable truth is that a 35% win rate with a 3:1 risk/reward ratio outperforms a 65% win rate with a 0.8:1 ratio over any meaningful sample size. The math does not care about how the trades feel. Aligning your evaluation framework with expectancy rather than raw accuracy is the single biggest mindset shift that separates developing traders from professionals.
— Tran
Quantlogicx tracks the metrics that actually matter
Knowing which metrics to watch is one thing. Having a system that surfaces them in real time is another.
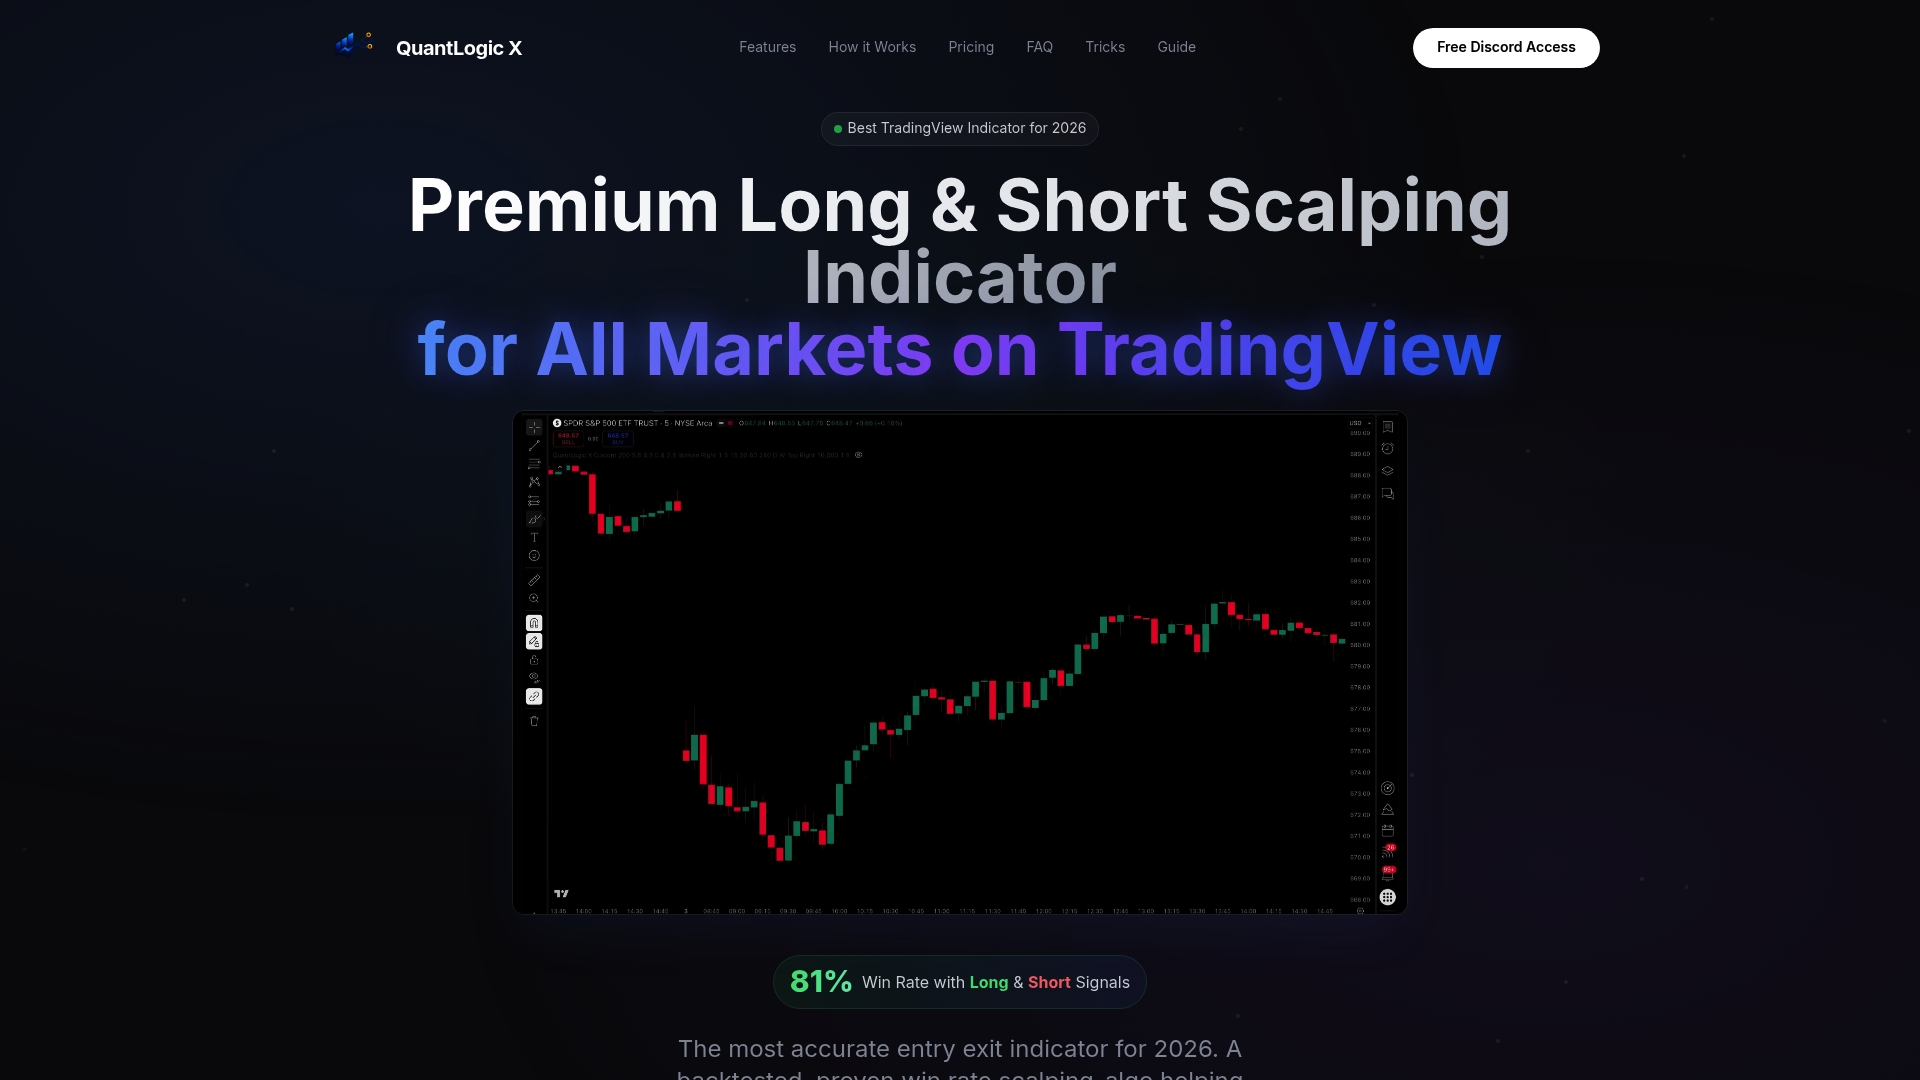
Quantlogicx is a TradingView indicator built for scalping across stocks, forex, and cryptocurrency. It reports an 81% win rate across its signals, with zero repaint technology that locks signals at bar closure so you always see accurate historical data. Over 2,000 traders use the algorithm, with individual users recording gains of $8,200 in a single month. The platform delivers real-time alerts and a community built around shared performance data. Whether you are tracking breakeven thresholds or monitoring expectancy across a live session, the Quantlogicx TradingView indicator gives you the signal clarity to act on your metrics with confidence.
FAQ
What is win rate in trading?
Win rate is the percentage of winning trades out of total trades, calculated as (Winning Trades ÷ Total Trades) × 100. A minimum sample of 50–100 trades is required for the number to be statistically reliable.
Can a high win rate still lose money?
Yes. A 70% win rate paired with a 0.5:1 risk/reward ratio produces a negative expectancy and loses money over time. Win rate must be evaluated alongside risk/reward ratio and average trade size.
What is a good win rate for a scalping strategy?
Scalping strategies typically target win rates of 55–65%. The tight risk/reward ratios common in scalping require higher accuracy to cover transaction costs and generate net profit.
How do I calculate my breakeven win rate?
Divide 1 by (1 + your risk/reward ratio). At a 1:2 ratio, the breakeven win rate is 33%. At 1:1, it is 50%. Your actual win rate must exceed this number to generate profit.
What is expectancy and why does it matter more than win rate?
Expectancy equals (Win Rate × Average Win) minus (Loss Rate × Average Loss). It is the only metric that accounts for both how often you win and how much you make or lose per trade, making it the definitive measure of whether a strategy is worth scaling.