

Win rate tells you how often you're right. Trade expectancy tells you whether being right is actually making you money. Those are two very different questions, and confusing them is one of the most common reasons traders with high win rates still blow up their accounts.
Trade expectancy is the average monetary outcome per trade across a large sample. The formula:
Expectancy = (Win Rate × Average Win) − (Loss Rate × Average Loss)
So if you win 55% of trades, average $300 on winners, and lose $400 on losers: Expectancy = (0.55 × $300) − (0.45 × $400) = $165 − $180 = −$15 per trade

That's a losing system despite a majority win rate. Win rate, by contrast, is simply:
Win Rate = Winning Trades ÷ Total Trades × 100
Win rate captures frequency of wins but says nothing about the size of those wins relative to losses. Expectancy captures both dimensions in a single number, which is why it's the definitive measure of whether a strategy has a real edge.
How different win rates and payoff ratios produce opposite outcomes
Two systems, same number of trades, completely different results:
| System | Win Rate | Avg Win | Avg Loss | Net P&L (100 trades) |
|---|---|---|---|---|
| A | 80% | $100 | $400 | $0 (breakeven) |
| B | — | $500 | $100 | +$11,000 |
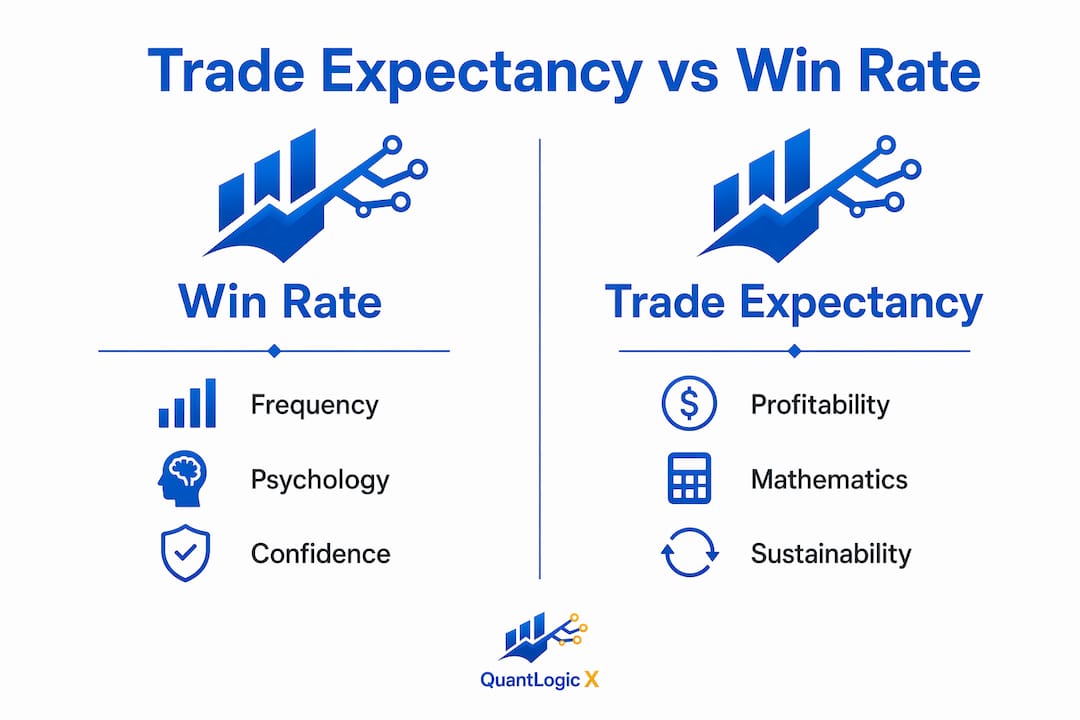
System A wins four out of five trades and still breaks even. System B loses nearly two-thirds of its trades and generates $11,000 profit over the same 100 trades. The math: System B's expectancy is (0.35 × $500) − (0.65 × $100) = $175 − $65 = +$110 per trade.
A third scenario worth seeing: a 30% win rate with a 4:1 reward-to-risk ratio. Average win $600, average loss $150. Expectancy = (0.30 × $600) − (0.70 × $150) = $180 − $105 = +$75 per trade. That trader feels like they're losing constantly. They're not.
The payoff ratio carries the math when win rate is low. Win rate carries the psychology. They don't always point in the same direction.
Why win rate alone misleads traders
Win rate is the most emotionally satisfying metric in trading. It's also the least reliable one for assessing profitability.
"Win rate is the least important variable in determining profitability." — Van Tharp, who studied over 5,000 trading systems and interviewed hundreds of professional traders.
Here's why that's true in practice:
- A 90% win rate strategy that wins $1 nine times and loses $20 once produces a net loss of $11 over 10 trades.
- Win rate ignores whether your average loss dwarfs your average win.
- Overemphasis on win rate often pushes traders to tighten profit targets and widen stop losses, which quietly destroys expectancy.
- High win rate creates emotional comfort, but comfort and profitability are separate things.
- A system can show a beautiful equity curve for months while running negative expectancy, then collapse when a few losses cluster together.
Win rate impacts psychology but not sustainability. Expectancy determines whether the system is mathematically sound over time.
How to calculate win rate and expectancy from your own trade journal
You don't need special software. You need a spreadsheet and honest records.
Step 1: Calculate your win rate
- Count all closed trades in your journal.
- Count how many closed positive (any profit, even $0.01).
- Divide winners by total trades, multiply by 100.
Step 2: Calculate average win and average loss
- Pull every winning trade's dollar result. Average them.
- Pull every losing trade's dollar result (as a positive number). Average them.
Step 3: Apply the expectancy formula
- Multiply win rate (as a decimal) by average win.
- Multiply loss rate (as a decimal) by average loss.
- Subtract step 2 from step 1.
Pro Tip: A positive result means your system has an edge. A negative result means no amount of position sizing will save it long term.
A few things to watch:
- Exclude open trades from the calculation.
- Use consistent position sizing across the sample, or normalize to R-multiples (each trade's result divided by your initial risk).
- Statistical validity requires a minimum of 150–250 trades. Fewer than 50 trades produces expectancy numbers that are essentially noise.
What counts as good expectancy and realistic win rate ranges
Not all positive expectancy is equal. Here's how to interpret what you're seeing:
- 0.05R–0.15R: Marginal. Likely goes negative after commissions and slippage.
- 0.20R–0.35R: Solid for an active system. This is the realistic target range for most traders.
- 0.40R–0.60R: Excellent. Worth protecting carefully.
- Above 0.60R: Exceptional on a large sample. Audit it carefully before trusting it.
Win rate benchmarks vary by style. Trend-following systems often run 30–40% win rates with positive expectancy because winners are 2–4 times the size of losers. Scalpers and mean-reversion traders typically need higher win rates because their reward-to-risk ratios are tighter.
The minimum win rate needed for breakeven depends entirely on your reward-to-risk ratio:
| Reward-to-Risk | Minimum Win Rate to Break Even |
|---|---|
| — | 50% |
| 1:1 | 50% |
| 2:1 | — |
| 3:1 | 25% |
| 4:1 | 20% |
With a 3:1 reward-to-risk ratio, you only need to be right 25% of the time to break even. Every win above that threshold is profit. Professional traders typically operate in the 50–55% win rate range, which means their edge comes primarily from keeping losses smaller than wins, not from being right most of the time.
Practical ways to improve your win rate and expectancy
Improving expectancy is more tractable than most traders realize, because it has three separate levers.
- Increase your reward-to-risk ratio. Move your take-profit further out, or tighten your stop without changing your target. Even a shift from 1:1 to 1.5:1 meaningfully changes the math.
- Cut losers faster. The single biggest drag on expectancy for most traders is letting losses run while cutting winners short. Reverse that habit.
- Filter trade setups more strictly. Fewer, higher-quality trades often raise both win rate and average win simultaneously.
- Track R-multiples, not dollars. Normalizing results to risk units makes it easier to spot whether your average win is actually larger than your average loss.
- Position sizing affects total returns but not expectancy per unit risk. Fix the expectancy first, then scale position size.
- Recalculate expectancy quarterly to catch regime changes that quietly erode your edge before they damage your account.
Pro Tip: Don't chase a higher win rate by tightening profit targets. That move usually shrinks your average win faster than it raises your win rate, leaving you with worse expectancy and the same emotional comfort.
Common misconceptions about win rate and expectancy
"A high win rate means I'm a good trader." Not necessarily. A 70% win rate with an average loss three times the average win produces negative expectancy. The equity curve looks fine until it doesn't.
"I need 50%+ win rate to be profitable." False. Many systematic trend-following strategies run profitably at 30–40% win rates because the payoff ratio compensates. The CTA managers of the early 2000s compounded wealth for years at those win rates.
"Expectancy is fixed once I calculate it." Expectancy is a dynamic metric. Market regimes shift, volatility changes, and correlations break down. A system that showed +0.35R expectancy in a trending market may show negative expectancy in a choppy one. That's why ongoing recalculation matters.
"A bigger sample always gives better expectancy." Sample size improves reliability, not the number itself. More trades give you a more accurate read on the true expectancy, but they don't inflate it.
Using expectancy and win rate together to evaluate trading strategies
Win rate and expectancy answer different questions, and you need both. Win rate tells you the shape of the equity curve: how smooth the ride feels, how often you'll face a losing streak, and whether the strategy suits your psychology. Expectancy tells you whether the strategy actually makes money.
A high-win-rate, low-expectancy strategy and a low-win-rate, high-expectancy strategy can produce similar annual returns while feeling completely different to trade. The first feels comfortable but may be fragile. The second feels brutal but compounds reliably.
When comparing two strategies, multiply expectancy by trade frequency. A +0.4R system taking 200 trades per month outperforms a +0.8R system taking 40 trades per month in total dollar terms. Per-trade profitability times frequency equals total profitability. That's the complete picture win rate alone can never give you.
Use win rate to decide if you can psychologically sustain a strategy. Use expectancy to decide if it's worth trading at all.
Real-world case studies: expectancy vs win rate in practice
Case 1: The scalper who felt invincible. A day trader running a mean-reversion strategy on SPY hit a 78% win rate over 200 trades. Average win: $80. Average loss: $310. Expectancy: (0.78 × $80) − (0.22 × $310) = $62.40 − $68.20 = −$5.80 per trade. The account bled slowly for months while the win rate kept the trader confident. Once expectancy was calculated, the problem was obvious: the average loss was nearly four times the average win.
Case 2: The trend follower who doubted himself. A swing trader using a breakout system on individual stocks won only 38% of trades. Average win: $920. Average loss: $280. Expectancy: (0.38 × $920) − (0.62 × $280) = $349.60 − $173.60 = +$176 per trade. The low win rate felt terrible psychologically. The math said otherwise.
Case 3: The balanced system. A trader running a 45% win rate with +1.8R average win and 1.0R average loss: (0.45 × 1.8) − (0.55 × 1.0) = 0.81 − 0.55 = +0.26R expectancy. Not flashy. Across 300 trades per year with $200 risk per trade, that's $15,600 in expected annual profit. Consistency beats excitement.
Quantlogicx: built around expectancy, not just win rate
Quantlogicx was built with this exact framework in mind. The TradingView indicator reports an 81% win rate across stocks, forex, and crypto, and the zero-repaint technology means signals are confirmed at bar close, not retroactively painted. That matters for expectancy calculations: you're measuring real, executable results, not backtested illusions.
Over 2,000 traders use the algorithm, with individual users reporting substantial gains in a single month. Whether you're a scalper tracking tight setups or a swing trader managing larger positions, Quantlogicx gives you the signal quality needed to keep both win rate and expectancy moving in the right direction.
Key Takeaways
Trade expectancy, not win rate, is the definitive measure of whether a trading strategy is profitable over a large sample of trades.
| Point | Details |
|---|---|
| Expectancy formula | Expectancy = (Win Rate × Avg Win) − (Loss Rate × Avg Loss); positive means a real edge. |
| Win rate is incomplete | An 80% win rate can break even or lose money if average losses dwarf average wins. |
| Solid expectancy range | 0.20R–0.35R is realistic for active systems; above 0.60R on a large sample is exceptional. |
| Sample size requirement | Expectancy needs 150–250 trades minimum to be statistically meaningful. |
| Frequency multiplies edge | Expectancy × trades per period equals total expected return; per-trade edge alone is not enough. |
FAQ
Is a 55% win rate good in trading?
A 55% win rate is solid if your average win is at least as large as your average loss. Professional traders typically operate in the 50–55% range, relying on disciplined loss management rather than a high win rate alone.
What is a good expectancy per trade?
A range of 0.20R–0.35R per trade is considered solid for an active system. Above 0.60R on a large sample is exceptional, though rare enough that it warrants careful auditing before trusting the number.
Is a 40% win rate good in trading?
Yes, if the reward-to-risk ratio is strong enough. A 40% win rate with a 2:1 reward-to-risk ratio produces positive expectancy, and many trend-following systems run profitably at 30–40% win rates by letting winners run well beyond average losses.
Is a 60% win rate good in trading?
Profitability depends on the size of wins versus losses. Even a win rate above average can produce negative expectancy if average losses exceed average wins.