

Win rate optimization in advanced trading is defined as the process of improving the ratio of profitable trades to total trades while maintaining positive mathematical expectancy across your full strategy. Most traders fixate on win rate alone and miss the bigger picture. A 70% win rate paired with a 0.5:1 risk-reward ratio produces losses over time, no matter how good it feels psychologically. The real goal is positive expectancy, which combines win rate, average win size, and average loss size into one number that tells you whether your edge is real. Techniques like market regime filtering, strategy ensembling, and the four-layer risk management framework are what separate traders who survive from those who blow up.
How to optimize win rate in advanced trading with expectancy math
Expectancy is the average amount you earn per dollar risked across all trades. The formula is straightforward: Expectancy = (Win Rate × Average Win) minus (Loss Rate × Average Loss). A trader with a 40% win rate and a 1:2 risk-reward ratio earns a positive expectancy of 0.20 per dollar risked. That beats a trader with a 65% win rate and a 0.5:1 ratio, who loses 0.025 per dollar risked over time.

The breakeven win rate formula clarifies exactly how low your win rate can go before you start losing money. Breakeven win rates are 50% at 1:1 risk-reward, 33% at 1:2, and 25% at 1:3. Professional traders routinely operate at 35–50% win rates because their risk-reward ratios are high enough to stay profitable. Chasing a 70% or 80% win rate often forces you into tight profit targets that crush your average win size.
The table below shows how win rate and risk-reward interact to produce positive or negative expectancy.
| Win Rate | Risk-Reward Ratio | Expectancy per $1 Risked |
|---|---|---|
| 70% | 0.5:1 | -$0.05 (losing) |
| 50% | 1:1 | $0.00 (breakeven) |
| 40% | 1:2 | +$0.20 (profitable) |
| 33% | 1:2 | +$0.00 (breakeven) |
| 35% | 1:3 | +$0.40 (profitable) |
The most common mistake traders make is measuring planned risk-reward instead of realized risk-reward. You set a 1:2 target, but you exit early at 1:1 because you feel nervous. Your actual expectancy collapses. Track both numbers in a trading journal every single day.
Pro Tip: Record your planned R:R and your actual realized R:R for every trade. If the gap between them is consistent, your psychology is costing you more than your strategy.
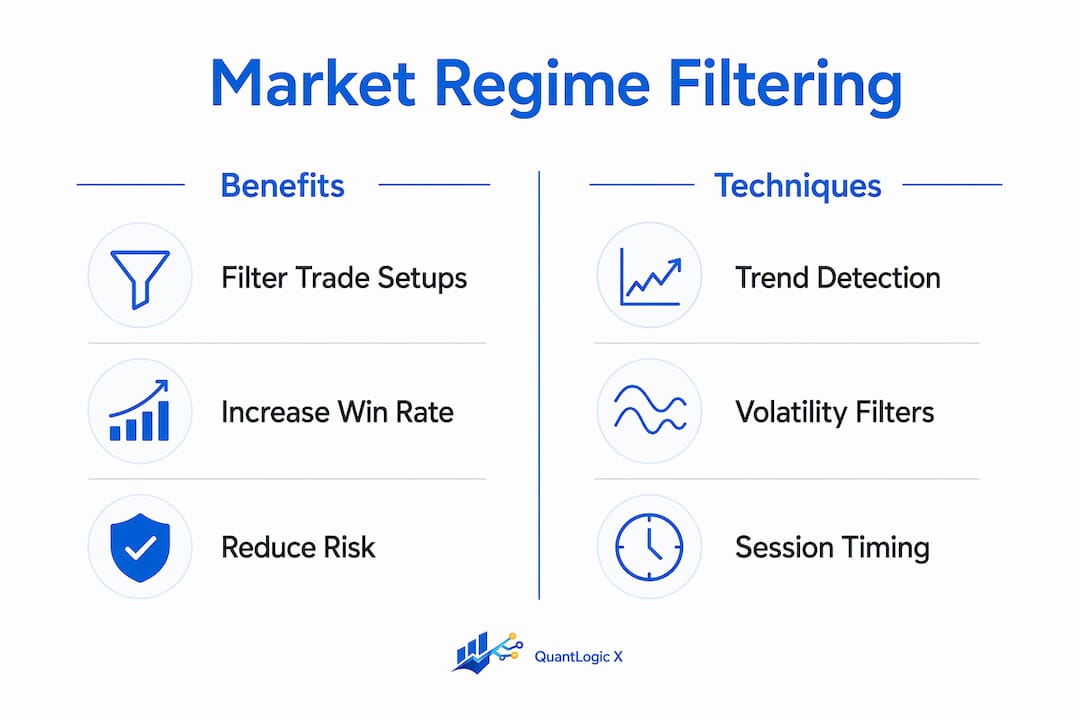
What is market regime filtering and how does it improve win rate?
Market regime filtering is the practice of only taking trades when the market environment matches your strategy's design. Every strategy has a regime where it performs well and a regime where it bleeds. Trend-following strategies work in trending markets and fail in choppy, ranging conditions. Mean-reversion strategies do the opposite.
Filtering trades by regime reduces trade volume by 50–70% while improving profit factor from roughly 1.2 to 1.9 or higher. That means you take fewer trades but keep nearly all of your net profit. Fewer trades with a higher win rate beats more trades with a mediocre one every time.
Regime detection does not require complex machine learning. Standard technical indicators identify regimes reliably when used correctly:
- ADX (Average Directional Index): Readings above 25 signal a trending regime; below 20 signal a ranging regime.
- Bollinger Band width: Expanding bands indicate trending or high-volatility conditions; contracting bands signal consolidation.
- 200-period moving average slope: A rising slope confirms an uptrend regime; a flat or falling slope signals chop or downtrend.
- ATR (Average True Range): Rising ATR identifies volatility expansion; falling ATR marks low-volatility, range-bound conditions.
- Volume profile: Above-average volume during breakouts confirms trend regime validity.
Market regime detection combined with strategy routing increases out-of-sample win rates by applying the right approach to the right condition. This is not curve-fitting. It is matching your tool to the job.
Pro Tip: Add a session filter on top of your regime filter. For forex, the London and New York overlap produces the most reliable trending setups. Avoid taking trend trades during the Asian session unless ADX confirms strong momentum.
Does strategy diversification actually stabilize win rates?
Strategy diversification, also called ensembling, stabilizes win rates by spreading risk across multiple uncorrelated edges. When one strategy enters a drawdown, another is often performing well. The net result is a smoother equity curve and fewer catastrophic losing streaks.
Optimal ensemble size is 3–5 strategies with correlation below 0.1 between each pair. Adding more strategies beyond five increases complexity and failure risk without meaningful diversification benefit. Adding highly correlated strategies is worse than adding none at all because it multiplies your directional exposure without reducing variance.
| Approach | Win Rate Stability | Drawdown Risk | Complexity |
|---|---|---|---|
| Single strategy | Low | High | Low |
| 2 correlated strategies | Low | Higher | Medium |
| 3–5 uncorrelated strategies | High | Reduced | Medium |
| 6+ strategies (mixed correlation) | Moderate | Unpredictable | High |
Position sizing rules matter as much as strategy selection. Cap your total directional exposure across all strategies at a defined percentage of your account. If three of your five strategies are all long equities at the same time, your correlation risk spikes even though you are running multiple systems. Correlation management at the portfolio level is what makes ensembling work in practice.
What are the best risk management layers for sustaining a high win rate?
Risk management is what keeps a profitable strategy alive long enough to compound. A four-layer framework covers every level of exposure from individual trades to your full portfolio. Skipping any layer is how accounts blow up despite having a genuine edge.
The four layers work as follows. First, trade-level risk: risk no more than 1% per trade, which means a ten-trade losing streak costs you less than 10% of your account. Second, daily loss limits: stop trading when you hit a 3% daily loss. Revenge trading after a bad morning is the fastest way to turn a bad day into a catastrophic one. Third, correlation risk: reduce position sizes when multiple open trades move in the same direction. Fourth, portfolio drawdown limits: set a level, typically 10–15% drawdown, where you stop trading entirely and review your strategy before resuming.
Position sizing adjusted for correlation protects capital during losing streaks that are statistically inevitable for every strategy. Losing streaks are not a sign your edge is gone. They are a normal feature of any probabilistic system.
Best practices for risk control:
- Set a hard per-trade risk limit of 0.5–1% of account equity.
- Apply a 3% daily loss cap and walk away when you hit it.
- Use a weekly loss cap of 5–6% to prevent compounding bad weeks.
- Reduce position size by 50% after five consecutive losses.
- Stop trading entirely at a 15% portfolio drawdown and conduct a full strategy review.
- Never add to a losing position to average down.
Hierarchical risk limits enforce capital preservation and psychological discipline simultaneously. When the rules are written down and non-negotiable, you remove the emotional decision-making that destroys accounts. Quantlogicx users benefit from real-time alerts that support disciplined entry and exit execution within these risk frameworks.
Pro Tip: Use a scalping-focused indicator with zero repaint signals to confirm entries before committing capital. Repaint signals distort your realized win rate data and make your journal useless.
Key Takeaways
Positive expectancy, not a high win rate alone, determines whether your trading strategy is profitable over time.
| Point | Details |
|---|---|
| Expectancy beats win rate | A 40% win rate with 1:2 R:R outperforms a 70% win rate with 0.5:1 R:R every time. |
| Regime filtering cuts noise | Filtering by market regime reduces trade volume by 50–70% while lifting profit factor to 1.9 or higher. |
| Ensemble 3–5 strategies | Use 3–5 uncorrelated strategies with correlation below 0.1 to stabilize returns and reduce drawdown risk. |
| Four-layer risk management | Apply trade-level, daily, correlation, and portfolio drawdown limits to survive losing streaks. |
| Track realized R:R daily | The gap between planned and realized risk-reward reveals where psychology is eroding your edge. |
The uncomfortable truth about chasing a high win rate
Most traders I have worked with come in obsessed with win rate. They want 70%, 80%, even 90%. What they do not realize is that high win rates mask losing strategies when risk-reward is poor. I have seen traders with 75% win rates blow their accounts because every winner was half the size of every loser.
The traders who last are not the ones with the highest win rates. They are the ones who understand their expectancy cold, filter their trades ruthlessly, and follow their risk rules even when it hurts. Discipline during a drawdown is harder than any technical analysis. You will want to override your daily loss cap. You will want to take that one extra trade to "make it back." Every time you do, you are borrowing from your future self.
Walk-Forward Optimization is the tool I recommend for validating any strategy before you risk real money. In-sample win rates above 80% are almost always curve-fits. If your strategy cannot hold up on out-of-sample data, it will not hold up in live markets. Test ruthlessly, filter aggressively, and size conservatively. That combination compounds faster than any high-win-rate shortcut.
The win rate indicators that actually help are the ones that give you reliable, non-repainting signals you can journal and measure. Without clean data, you cannot improve. Without improvement, you are just gambling with extra steps.
— Tran
Quantlogicx: built for traders who want reliable signals
Traders who apply the techniques in this guide need one thing above all else: signals they can trust. Quantlogicx delivers exactly that through its TradingView indicator, which is built specifically for scalping across stocks, forex, and cryptocurrency.
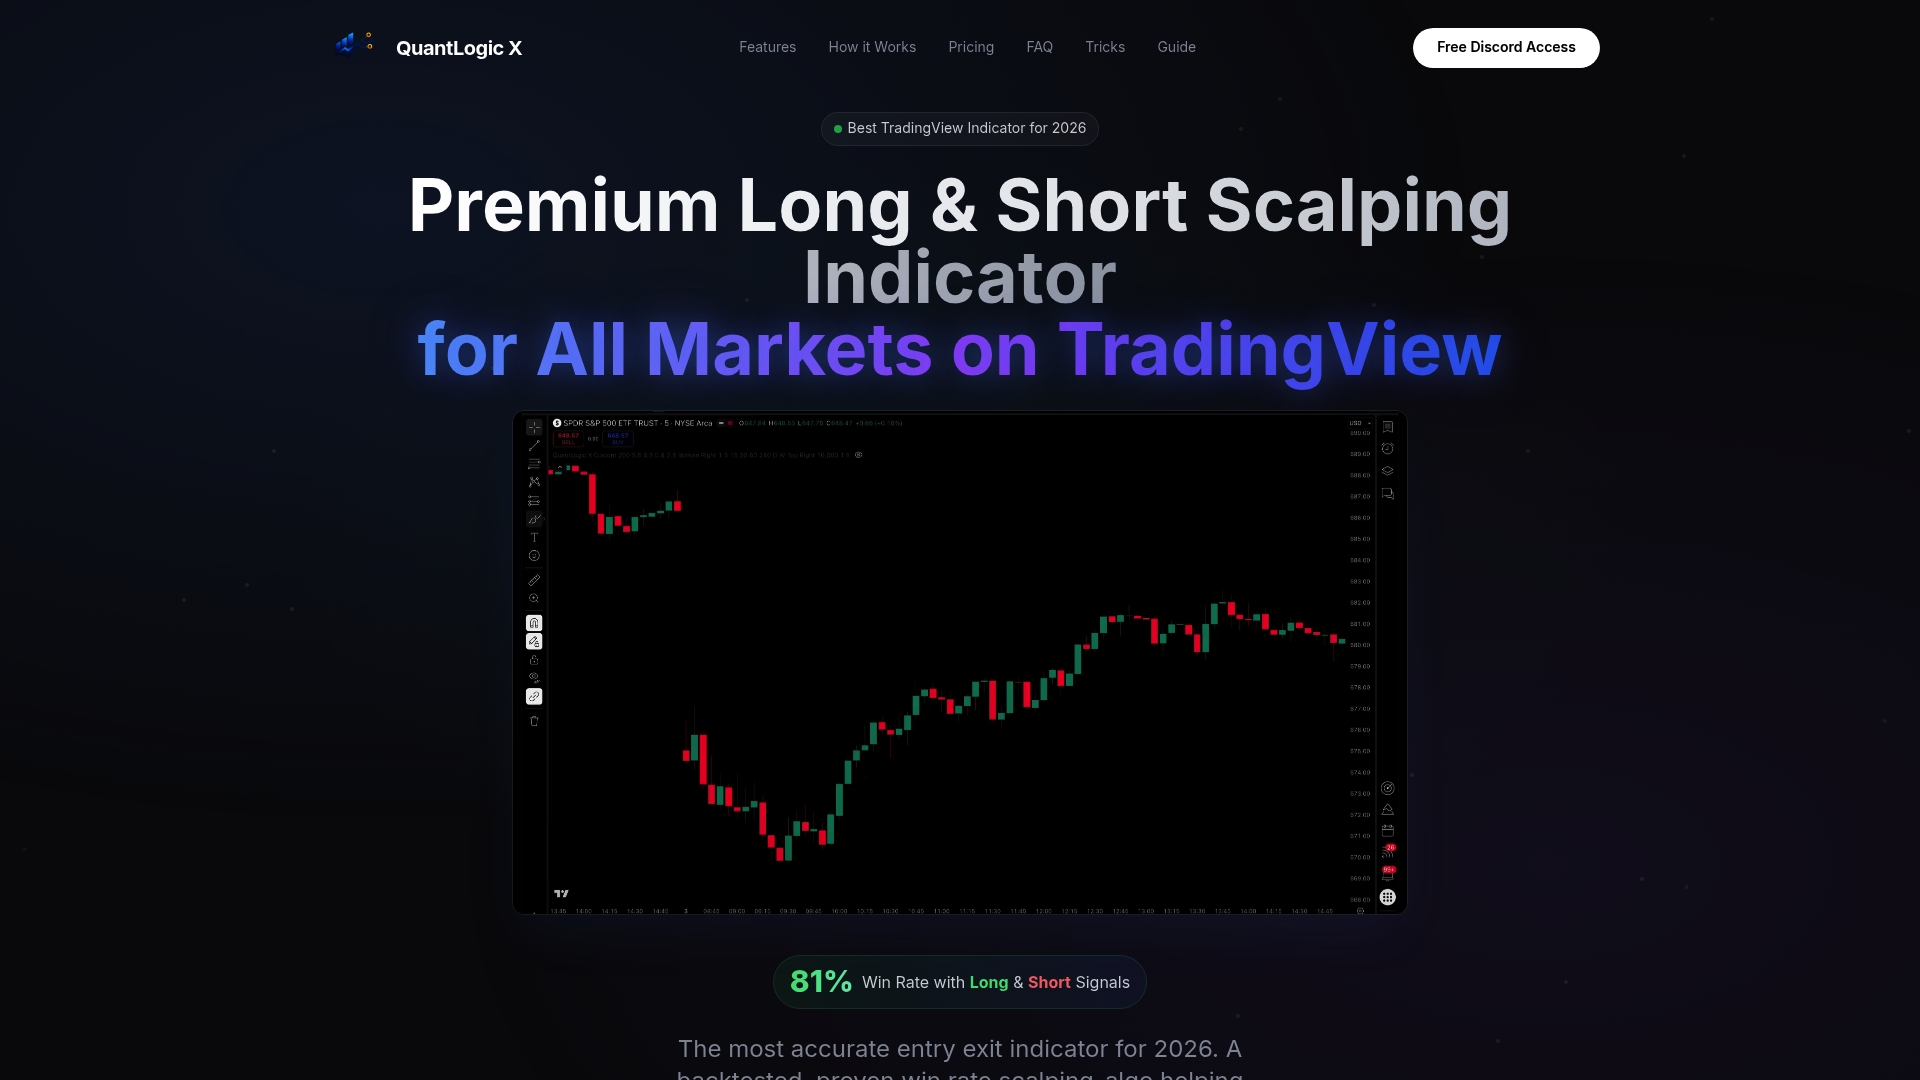
The Quantlogicx algorithm reports an 81% win rate and uses zero repaint technology, meaning every long and short signal is locked in at bar closure. Over 2,000 traders have adopted the system, with individual users recording gains of $8,200 within a single month. Real-time alerts and a supportive trading community make it practical for both newer traders and experienced ones who want consistent signals without the noise of traditional indicators. See how the Quantlogicx TradingView indicator fits into your advanced trading framework, or visit quantlogicx.com to review the full indicator suite.
FAQ
What is the breakeven win rate for a 1:2 risk-reward ratio?
The breakeven win rate at a 1:2 risk-reward ratio is 33%. Any win rate above 33% with that ratio produces positive expectancy over time.
How does market regime filtering improve trading performance?
Regime filtering removes low-quality setups by only trading when market conditions match your strategy's design. This reduces trade volume by 50–70% while significantly improving profit factor.
How many strategies should I run in a trading portfolio?
The optimal number is 3–5 uncorrelated strategies. Correlation between each pair should stay below 0.1 to gain real diversification benefit without adding unnecessary complexity.
What per-trade risk percentage protects against losing streaks?
Risking no more than 1% per trade means a ten-trade losing streak costs less than 10% of your account. Many professional traders use 0.5% for additional protection during volatile periods.
Does a high win rate guarantee profitability?
No. A high win rate does not guarantee profitability if the average loss is larger than the average win. Expectancy, which combines win rate and risk-reward, is the only reliable measure of a strategy's true edge.