

Selecting a high win rate trading tool comes down to one non-negotiable: win rate alone tells you almost nothing. The traders who consistently profit combine a verified win rate with a sound reward-to-risk ratio and a positive expectancy after real costs. Tools that pass that three-part test are rare. Quantlogicx's indicator, for example, reports an 81% win rate with zero repaint technology across stocks, forex, and crypto, and more than 2,000 traders have used it to generate documented profits. That combination of verified performance, signal reliability, and broad market coverage is exactly the benchmark to hold any tool against.
Before you commit to any platform or indicator, check these five criteria:
- Verified win rate with sample size. A claim built on fewer than 500 trades is statistically weak.
- Reward-to-risk ratio. A 70% win rate paired with a 0.5:1 R:R loses money over time.
- Net expectancy after costs. Slippage and commissions can erase a thin edge entirely.
- Zero repaint signals. Signals that repaint after the bar closes are not tradeable in real time.
- Platform integration and alerts. TradingView compatibility and real-time notifications keep you in the trade.
Table of Contents
- How win rate and risk/reward ratio actually work together
- Common misconceptions that lead traders to pick the wrong tools
- How to test and validate a high win rate trading strategy
- Practical criteria for selecting and using high win rate trading tools
- Quantlogicx gives you a verified edge, not just a win rate number
- FAQ
- Key Takeaways
How win rate and risk/reward ratio actually work together
Most traders treat win rate as the headline number and stop there. That is the wrong frame. Cory Mitchell, CMT, makes the point plainly: professional success depends on expectancy, which combines how often you win with how much you win when you do. Win rate is just one input.
The math is straightforward. Expectancy per trade equals (win rate × average win) minus (loss rate × average loss). A 40% win rate with a 2:1 reward-to-risk ratio produces an expectancy of $0.60 per dollar risked. A 70% win rate with a 0.5:1 ratio produces $0.05. The 40% win rate strategy wins by a wide margin, even though it loses more often.
Pro Tip: Before evaluating any tool's win rate claim, ask what reward-to-risk ratio sits behind it. A 90% win rate with a 0.1:1 R:R is a losing strategy in disguise.
Different trading styles naturally produce different win rate ranges:
- Scalping and mean reversion: 55–70% win rate, with tight targets and wider stops creating frequent small wins
- Intraday and swing discretionary: 45–55%, balanced geometry
- Trend following: 30–45%, where the math works because winners are multiples of losers
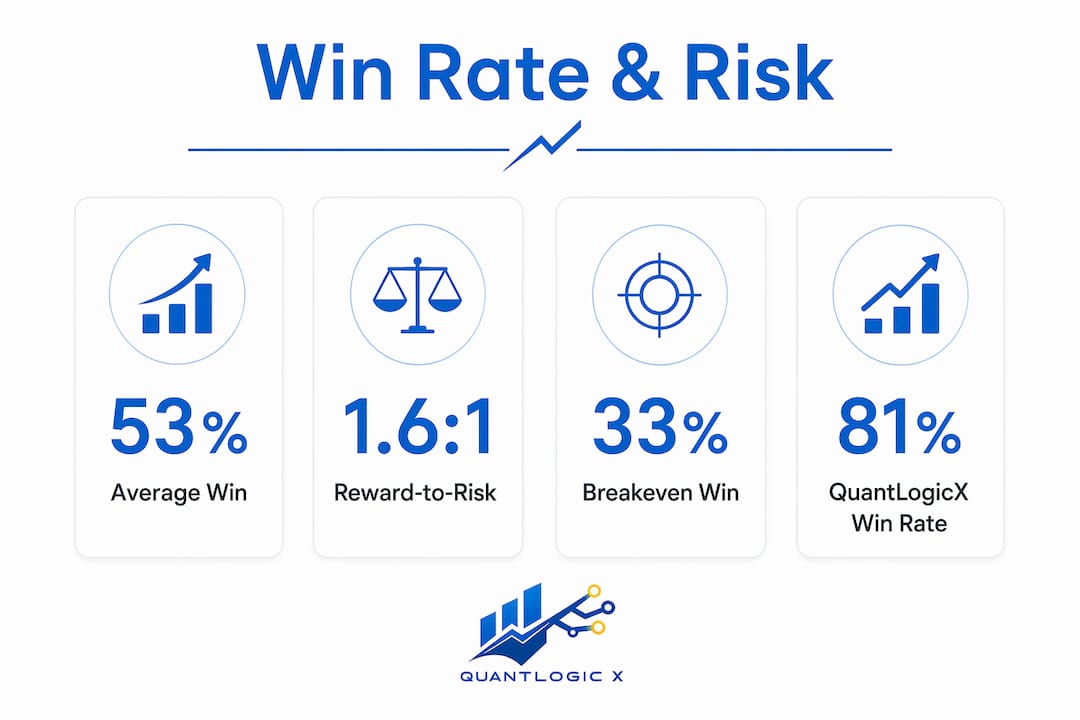
Consistently profitable traders average a win rate of around 53% with a 1.6:1 reward-to-risk ratio over six or more months of data. That combination, not a flashy win rate number, is what separates traders who grow accounts from those who slowly drain them.
The breakeven win rate formula is simple: divide 1 by (1 plus your R:R ratio). At a 2:1 R:R, you only need to win 33% of trades to break even. At 1:1, you need 50%. Understanding where your strategy sits relative to that breakeven line is the first real test of any tool you are considering.
Common misconceptions that lead traders to pick the wrong tools
The most expensive mistake in tool selection is treating a high win rate as proof of profitability. A 40% win rate with 2:1 R:R often outperforms a 70% win rate with a 0.5:1 ratio, yet traders consistently gravitate toward the higher percentage. That gravitational pull toward win rate is what creates the "win rate trap."
Here are the misconceptions that cost traders the most:
- Win rate without context. A 75% win rate at a 0.33:1 R:R requires winning 75% of trades just to break even. The number looks impressive; the math is brutal.
- Small sample sizes. Testing a strategy on 100 trades yields conclusions that are statistically unreliable. Variance at that sample size can make a losing strategy look like a winner for months.
- Ignoring trading costs. Raw win rates of 50–55% often collapse to breakeven or a net loss once realistic spreads, commissions, and slippage are applied. The edge disappears before a single dollar is banked.
- Confusing market-making win rates with directional trading. Algorithmic market makers can achieve win rates exceeding 99% by capturing spreads, not by predicting price direction. That context is entirely different from what a retail directional trader needs.
- Overfitting to historical data. A strategy optimized on past data can show extraordinary win rates that evaporate in live markets. If a profit factor exceeds 3.0 on a small sample, that is a red flag, not a badge.
- Widening stops to boost win rate. This is the most expensive shortcut in trading. Wider stops inflate win percentage while silently destroying R:R, leaving the trader with a strategy that feels good and performs poorly.
- Comparing win rates across styles. A trend follower with a 35% win rate is not underperforming a scalper at 65%. They may be twice as profitable once payoff geometry is factored in.
The psychological pull toward high win rates is real and documented. Frequent wins feel good. Losing streaks feel catastrophic. But a 55% win rate strategy will statistically produce five consecutive losses in the vast majority of trading years. If that streak breaks your conviction or your risk plan, the edge never gets to pay you.
How to test and validate a high win rate trading strategy
Validation is where most traders cut corners, and it is exactly where the difference between a real edge and a lucky streak gets revealed.
The process has a clear sequence:
- Define the rules completely before testing. Entry criteria, exit criteria, stop placement, and position sizing must all be fixed. A strategy with discretionary elements cannot be backtested honestly.
- Run the backtest on at least 500 trades. Fewer than that and variance dominates the result. Statistical confidence in win rate requires large samples to filter out false positives from random market noise.
- Track the right metrics. Win rate, profit factor, average R:R, maximum drawdown, and expectancy per trade. Win rate without profit factor is incomplete data.
- Apply realistic costs. Subtract commissions, spreads, and an estimate for slippage. A strategy that looks strong on gross numbers may be marginal or negative net.
- Forward test in a paper account for at least 60 days. Live market conditions, including gaps, news events, and liquidity changes, behave differently than historical data.
- Check for consistency across market regimes. A strategy that works in trending markets but fails in range-bound conditions has a narrower edge than the backtest suggests.
| Metric | Minimum Acceptable | Strong Performance |
|---|---|---|
| Win rate (scalping/mean reversion) | 55% | 65%+ |
| Win rate (swing/trend) | 35% | 45%+ |
| Profit factor (after costs) | 1.2 | 1.5–2.5 |
| Reward-to-risk ratio | 1:1 | 2:1 or higher |
| Sample size | 500 trades | 1,000+ trades |
| Forward test period | 60 days | 6 months |
Quantlogicx's indicator has been validated across a large number of live traders in stocks, forex, and crypto markets. User-reported results include documented gains within a single month, reflecting real-world performance rather than backtested projections. That distinction matters because live results carry execution costs, slippage, and emotional variables that backtests cannot replicate.
Pro Tip: When evaluating any tool's win rate claim, ask for the profit factor, not just the win percentage. A profit factor below 1.2 after costs means the strategy loses money regardless of how high the win rate looks.

One pattern worth watching: traders who improve their R:R by just 0.1–0.2 through tighter stop management or extended profit targets often shift from unprofitable to profitable without changing a single entry signal. That is the highest-leverage adjustment available to most losing traders, and it is something a good tool should support through configurable alert parameters and clear signal timing.
Practical criteria for selecting and using high win rate trading tools
Choosing the right tool is not about finding the highest advertised win rate. It is about finding a tool whose verified performance holds up under the criteria that actually predict live profitability.
What to look for in any trading tool
- Zero repaint signals. If a signal changes after the bar closes, it cannot be traded in real time. This is a non-negotiable filter. Tools that repaint look great in hindsight and fail in practice.
- Verified sample size. Ask how many trades the win rate is based on. Anything under 500 trades is a marketing number, not a statistical one.
- Real-time alerts. A signal you see five minutes late is a missed trade. TradingView integration with push notifications and email alerts keeps execution tight.
- Multi-market applicability. A tool that works only in one asset class or one market condition has a narrower edge than one validated across stocks, forex, and crypto.
- Active user base. A community of live traders provides ongoing validation. If thousands of traders are using a tool in real accounts, the performance data is far more credible than a solo backtest.
- Transparent methodology. The best tools explain how signals are generated. Opacity is a warning sign.
Quantlogicx in practice
Quantlogicx's TradingView indicator was built specifically for scalping across multiple markets, and its 81% win rate is backed by zero repaint technology, meaning every long and short signal is locked at bar closure. That is the feature that separates it from most indicators on the market, where repainting makes historical performance look far better than live performance.
The real-time alert system means traders do not need to watch charts continuously. The signal fires, the alert arrives, and the trade can be executed at the right bar. For scalpers especially, that timing precision is the difference between catching a move and chasing it.

The community element is underrated. When more than 2,000 traders are running the same indicator across different markets and timeframes, the collective feedback loop accelerates learning. A novice trader gets access to how experienced traders are applying the tool, which setups they filter, and which market conditions they avoid. That shared knowledge base is not something a standalone indicator provides.
To get the most from any high-probability tool, combine the signals with a fixed risk rule: never risk more than 1–2% of account equity per trade, regardless of how strong the signal looks. The win rate metrics guide from Quantlogicx's blog covers how to track and interpret these figures over time, which is the only way to know whether your live results are matching the tool's documented performance.
Monitoring matters as much as selection. Market conditions shift, and a tool that performs well in trending markets may need parameter adjustments during low-volatility periods. Set a monthly review: check your win rate, profit factor, and average R:R against your baseline. If any metric drifts more than 10% from your forward-test results, investigate before continuing at full size.
For traders looking to measure indicator performance objectively, the trading indicator performance framework covers the quantitative techniques that separate real edges from noise.
Quantlogicx gives you a verified edge, not just a win rate number
Most indicators give you a percentage and ask you to trust it. Quantlogicx gives you the same 81% win rate claim, then backs it with zero repaint technology, live trader results across three asset classes, and a community of more than 2,000 active users who are running it in real accounts right now.
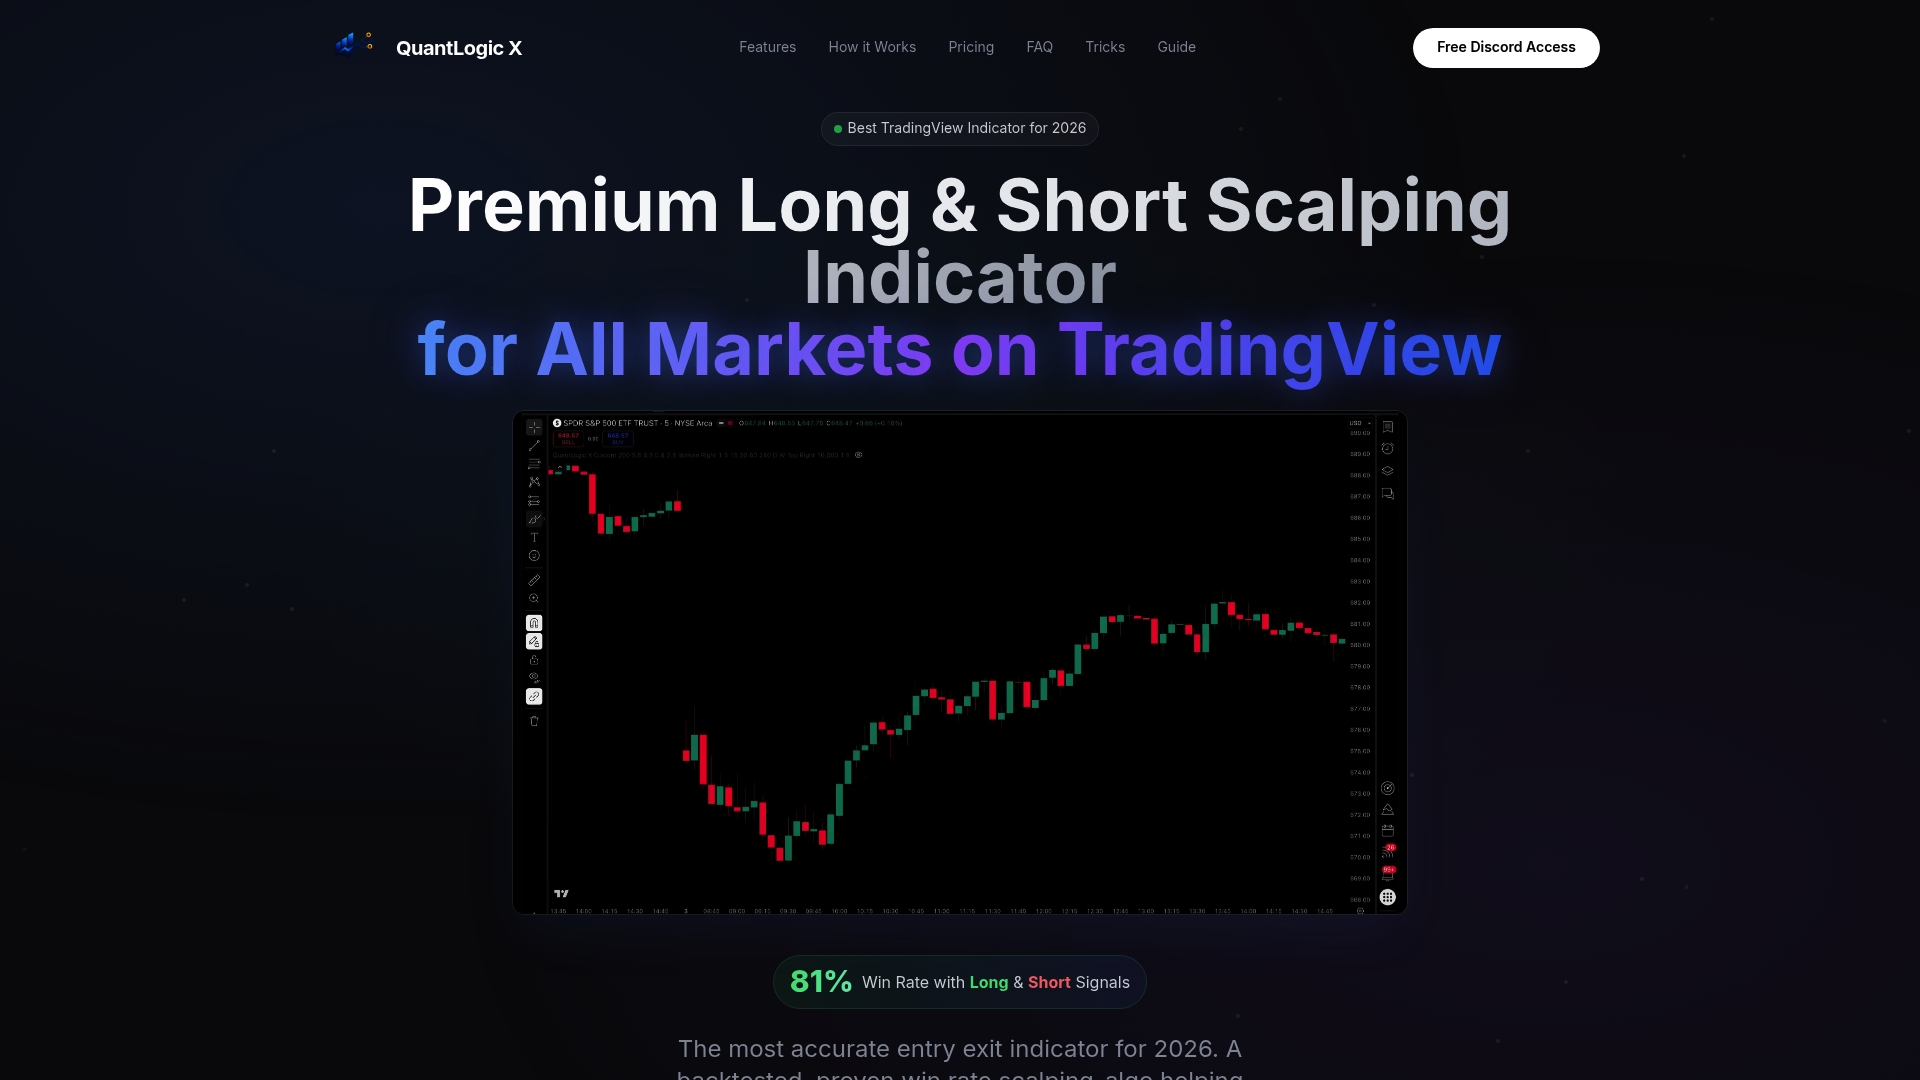
For traders coming from this article, the fit is direct. You now know that win rate only matters paired with a sound R:R and positive expectancy. Quantlogicx's indicator is built for scalping, where the geometry naturally supports frequent wins at a reward-to-risk ratio that keeps expectancy positive. The zero repaint guarantee means the 81% figure reflects real, tradeable signals, not a backtested illusion. Real-time TradingView alerts handle execution timing. The community handles the learning curve.
If you trade stocks, forex, or crypto and want a signal tool with documented live performance, check the QuantLogic X indicator and see the verified results for yourself.
FAQ
What is the highest win rate strategy in trading?
Range trading and mean reversion typically produce the highest raw win rates, often 60% or higher in low-volatility conditions, but the average loss on a failed trade is several times the average winner. Market-making algorithms can exceed 99% by capturing spreads rather than predicting direction, which is a structurally different approach from retail directional trading.
What win rate do consistently profitable traders actually average?
Consistently profitable traders average a 53% win rate paired with a 1.6:1 reward-to-risk ratio over six or more months of data. Win rate alone does not determine profitability; the R:R ratio is equally critical.
What is the 3-5-7 rule in trading?
The 3-5-7 rule is a position sizing guideline: risk no more than 3% of capital on any single trade and keep total open risk below 5% across all positions. Definitions vary across trading communities, but this version reflects the most common application.
How do I know if a trading tool's win rate claim is real?
Ask four questions: What reward-to-risk ratio sits behind the win rate? How many trades is the sample based on (500 is the minimum for statistical reliability)? Are the numbers net of commissions and slippage? Does the tool use zero repaint technology? If any of those four answers are missing or vague, the win rate figure is not tradeable evidence. Quantlogicx publishes its 81% win rate with zero repaint signals and live user results across multiple markets, which satisfies all four criteria.
Key Takeaways
Selecting a high win rate trading tool requires verifying win rate, reward-to-risk ratio, and net expectancy together, because no single metric predicts profitability on its own.
| Point | Details |
|---|---|
| Win rate needs R:R context | A 40% win rate at 2:1 R:R outperforms a 70% win rate at 0.5:1 in net expectancy. |
| Sample size determines validity | At least 500 trades are needed for a win rate claim to carry statistical weight. |
| Costs erode thin edges | Raw win rates of 50–55% often reach breakeven or a net loss after real commissions and slippage. |
| Zero repaint is non-negotiable | Signals that repaint after bar close cannot be traded in real time and inflate historical win rates. |
| Quantlogicx verified performance | The Quantlogicx indicator reports an 81% win rate with zero repaint technology, used by more than 2,000 live traders across stocks, forex, and crypto. |