

Stock market indicators are mathematical calculations applied to price, volume, and time data that help traders interpret market conditions rather than predict future prices. Understanding how stock market indicators work explained through their four core categories, trend, momentum, volatility, and volume, gives you a structured way to read charts without guessing. The Relative Strength Index (RSI), Moving Average Convergence Divergence (MACD), Bollinger Bands, and simple Moving Averages are the most widely used tools in this field. Each one answers a specific question about market behavior, and knowing which question each answers is the difference between using indicators well and using them blindly.
How stock market indicators work explained: the core framework
Technical indicators classify into two broad groups: overlays and oscillators. Overlays plot directly on the price chart, like Moving Averages and Bollinger Bands. Oscillators appear in a separate panel below the chart and measure values on a bounded or unbounded scale, like RSI and MACD.
The four components every indicator measures are trend, momentum, volatility, and volume. Trend indicators show which direction price is moving over time. Momentum indicators measure the speed of that movement. Volatility indicators show how much price fluctuates. Volume indicators confirm whether price moves have conviction behind them.

One distinction traders often miss is the difference between leading and lagging indicators. Leading indicators, like RSI, attempt to signal a potential shift before it fully develops. Lagging indicators, like Moving Averages, confirm a move that is already underway. Neither type predicts the future. Both organize past data to help you make a more consistent decision right now.
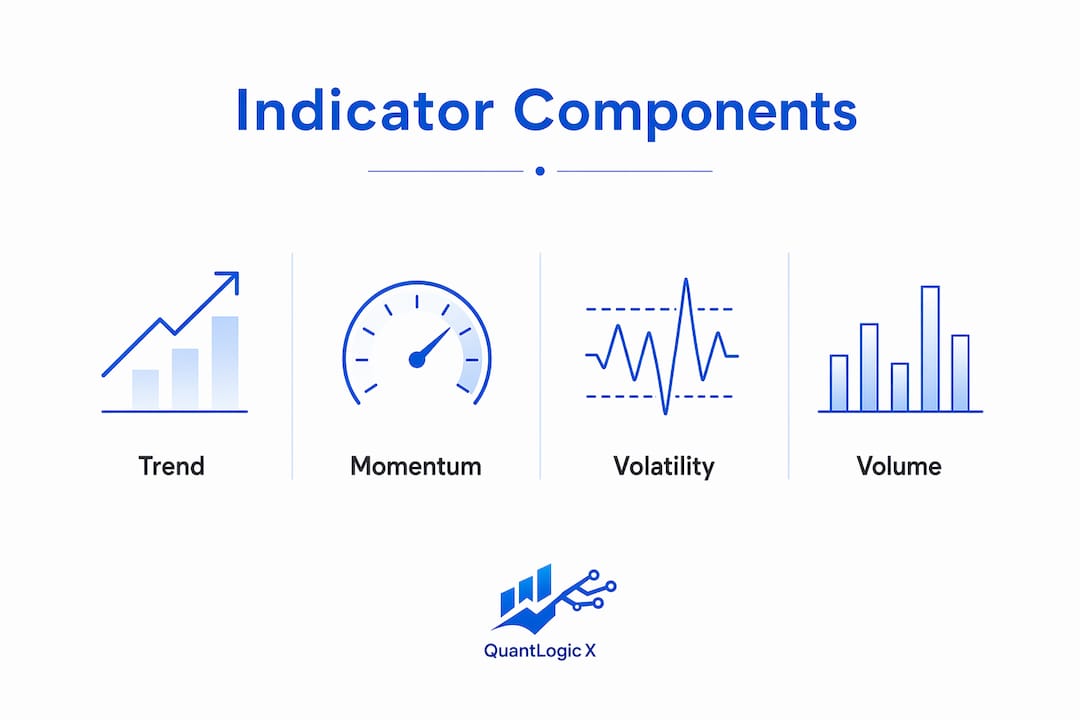
| Category | What it measures | Common examples |
|---|---|---|
| Trend | Direction of price movement | Simple Moving Average (SMA), Exponential Moving Average (EMA) |
| Momentum | Speed and strength of movement | RSI, MACD, Stochastic Oscillator |
| Volatility | Range and intensity of price swings | Bollinger Bands, Average True Range (ATR) |
| Volume | Buying and selling pressure | On-Balance Volume (OBV), Volume Weighted Average Price (VWAP) |
Pro Tip: Assign each indicator in your setup to one of these four categories before you trade. If two indicators answer the same question, remove one. Redundancy adds noise, not clarity.
What do the most popular indicators actually measure?
Moving averages: trend filters, not entry signals
Moving averages smooth price data by averaging closing prices over a set number of periods. The Simple Moving Average (SMA) weights all periods equally. The Exponential Moving Average (EMA) weights recent prices more heavily, so it reacts faster to new data. The 20, 50, and 200 period MAs are the most widely used levels for identifying trend direction and key support or resistance zones. Traders use crossovers, where a shorter MA crosses above or below a longer one, as potential trend shift signals.
RSI: reading overbought and oversold conditions
RSI oscillates between 0 and 100, with readings above 70 flagging overbought conditions and readings below 30 flagging oversold conditions. J. Welles Wilder designed the standard version using a 14-period setting, though shorter periods make it more sensitive and longer periods smooth it out. The more reliable RSI signal is divergence, where price makes a new high but RSI does not, suggesting the move is losing momentum. That divergence pattern gives you more context than a simple overbought reading alone.
MACD and Bollinger Bands: momentum and volatility together
MACD combines two EMAs into a single momentum oscillator. When the MACD line crosses above its signal line, it suggests bullish momentum is building. The histogram shows the distance between those two lines, giving you a visual read on how fast momentum is shifting. Bollinger Bands place two standard deviation lines above and below a central Moving Average. When the bands contract, volatility is low and a price expansion is likely. When price walks along the upper band on strong volume, the trend is probably intact, not overextended.
The Average True Range (ATR) measures the average distance between a period's high and low, adjusted for gaps. It does not indicate direction. ATR tells you how much a market typically moves, which makes it the most practical tool for setting stop distances and sizing positions relative to actual market conditions.
Pro Tip: Use ATR to set your stop loss instead of a fixed dollar amount. A stop placed at 1.5x ATR below your entry reflects real market volatility, not an arbitrary number.
What mistakes do traders make with indicators?
The most common mistake is treating indicators as prediction tools. No indicator predicts future prices. They confirm conditions that already exist in the data. Expecting an RSI reading to tell you what price will do next leads to frustration and bad trades.
"Most traders mistakenly expect indicators to predict the market. Their true value is organizing evidence to enhance decision-making consistency within a strategy." Insight Ginie
Indicator overload is the second major problem. Indicator overload leads traders to confusion and hesitation. Stacking five momentum oscillators on one chart does not give you five times the information. It gives you five versions of the same signal, which creates paralysis when they slightly disagree.
A third mistake is over-optimization. Backtests optimized for perfect fit on past data often fail in live trading because slippage, commissions, and volatility shifts change the environment. Tweaking RSI from 14 periods to 11 because it would have worked better last year is curve-fitting, not strategy building.
Indicators that repaint or adjust historical data retrospectively are particularly dangerous. A signal that looks clean on a historical chart but shifts after the bar closes is not a real signal. Always verify that your indicator locks its value at bar close before you trust it in live conditions.
Pro Tip: Apply "indicator hygiene" to your setup every month. Remove any indicator that has not contributed to a better decision in your last ten trades. Clarity beats complexity every time.
How to build indicators into a real trading strategy
Start by identifying the market environment before you look at any indicator. Is price trending or ranging? Is volatility expanding or contracting? Indicators perform very differently depending on the answer. A Moving Average crossover works well in a trending market and generates false signals in a choppy one.
- Define the market structure first. Use price action and a 200-period SMA to determine whether you are in a trend or a range before applying any other tool.
- Pick one indicator per category. Choose one trend filter, one momentum trigger, and one volatility measure. That combination covers the most useful trading context without redundancy.
- Set clear entry and exit rules. Write down exactly what signal combination triggers a trade and what invalidates it. Vague rules produce inconsistent execution.
- Use ATR for stop placement. Size your position so that a stop at 1.5x or 2x ATR risks no more than 1%–2% of your account on any single trade.
- Test against a baseline. Compare your indicator-based results to a simple buy-and-hold or price-action-only approach. Indicators generate profits only when they add measurable edge over a simpler method.
- Keep settings consistent. Changing indicator parameters between trades prevents you from building reliable personal data on what actually works.
Structured historical market data is what makes indicator calculations meaningful. Without clean, consistent data inputs, even well-designed indicators produce unreliable outputs. This matters especially when you are backtesting a strategy across multiple markets or timeframes.
Pro Tip: Keep a trading journal that records which indicator signal triggered each trade and whether the outcome matched the signal's implication. After 30 trades, patterns in your own data will tell you more than any backtest.
Key Takeaways
Stock market indicators work by organizing historical price and volume data into readable signals that confirm market conditions, not predict them.
| Point | Details |
|---|---|
| Indicators confirm, not predict | Every indicator reflects past data; use them to confirm conditions, not forecast price. |
| Four core categories | Trend, momentum, volatility, and volume indicators each answer a distinct question about market behavior. |
| One indicator per category | Stacking similar indicators adds noise; assign each tool a clear role before trading. |
| ATR for risk sizing | Use Average True Range to set stop distances and position sizes based on actual volatility. |
| Indicator hygiene matters | Remove any indicator that has not improved a decision in your last ten trades to maintain clarity. |
Why most traders get indicators backwards
The traders I see struggle most with indicators are not the ones who use too few. They are the ones who use too many and then blame the tools when results disappoint. I spent a long time in that camp myself, running four or five oscillators on a single chart and wondering why my signals conflicted. The answer was simple: I was asking the same question five different ways and expecting five different answers.
The shift that changed my trading was treating each indicator as a witness, not a judge. RSI tells me whether momentum is fading. A 50-period EMA tells me whether I am trading with or against the trend. ATR tells me how much room to give the trade. None of them tell me whether the trade will work. That is the wrong expectation, and it leads to the worst habit in trading: adjusting your rules after a loss instead of trusting a process that has a statistical edge.
Simplicity is not a beginner's compromise. It is what experienced traders arrive at after years of adding complexity and finding it does not help. The most reliable trade signals I have seen come from setups with two or three clear conditions, not ten. If you cannot explain your entry rule in one sentence, the setup is probably too complicated to execute consistently under pressure.
— Tran
Quantlogicx signals built for traders who want clarity
Traders who want indicators that do the heavy lifting without the complexity have a direct option in Quantlogicx. The Quantlogicx TradingView indicator delivers long and short signals across stocks, forex, and cryptocurrency, built on zero repaint technology so every signal locks at bar close.
Over 2,000 traders use the Quantlogicx algorithm, with individual users recording gains of $8,200 within a single month. The platform integrates real-time alerts and a community of active traders, so you are never reading signals in isolation. For traders who want a buy/sell indicator that fits directly into a disciplined strategy, Quantlogicx is worth a close look. You can explore the full indicator suite at quantlogicx.com.
FAQ
What are stock market indicators?
Stock market indicators are mathematical calculations based on price, volume, or time data that help traders identify trends, momentum, volatility, and volume conditions in a market.
Do indicators predict where a stock price will go?
No indicator predicts future prices. They confirm existing market conditions and help traders make more consistent decisions within a defined strategy.
What is the difference between RSI and MACD?
RSI measures momentum on a 0–100 scale to identify overbought or oversold conditions, while MACD combines two EMAs to show the direction and strength of momentum shifts.
How many indicators should a trader use at once?
One indicator per category is the standard practice. Using one trend filter, one momentum tool, and one volatility measure covers the most useful context without creating conflicting signals.
What does "repainting" mean in a trading indicator?
Repainting means an indicator adjusts its historical signal values after the bar closes, making past signals look better than they were in real time and making the indicator unreliable for live trading.