

A long signal indicator is a technical tool that identifies favorable bullish entry points by analyzing momentum, price action, and trend strength. In professional trading, understanding what is a long signal indicator separates traders who react from those who anticipate. These tools do not predict the future. They improve decision probability by structuring entry logic around measurable market conditions. Professional traders target risk-reward ratios of 1.5x to 2x per trade, and a well-calibrated long signal indicator is the first step toward hitting those targets consistently.
What is a long signal indicator and how does it work?
A long signal indicator generates a buy signal when specific technical conditions align to suggest a bullish move is likely. The core mechanics combine moving average crossovers, momentum filters, and trend baseline confirmations into a single output: a visual marker telling you when to enter a trade.
Most long signal indicators follow a layered confirmation model. A signal triggers only when price sits above a trend baseline, such as the 50-period EMA, and momentum readings cross a defined threshold. Avoid trading when RSI fluctuates between 40–60, since that range signals a directionless market where long entries carry high false-positive risk. This filtering logic is what separates a quality buy signal in trading from random noise.
The calculation process works in three stages:
- Trend baseline check: Price must be above a moving average (commonly the 50-period or 200-period EMA) to confirm the broader direction is bullish.
- Momentum filter: An oscillator like RSI or a proprietary momentum score must exceed a set threshold, typically above 60%, confirming buying pressure is building.
- Volatility gate: ATR-based volatility filters disable signals during sideways or choppy conditions, protecting capital from whipsaw losses.
Non-repainting technology is the fourth and most critical layer. Non-repainting signals lock at candle close, meaning the marker you see on your chart will not move or disappear after the bar closes. Repainting indicators rewrite history, making backtests look far better than live performance ever will.
Pro Tip: Before trusting any long signal indicator, run it on a closed historical chart and check whether past signals have shifted position. If they have, the indicator repaints and its backtest results are unreliable.
What types of long signal indicators do traders use?
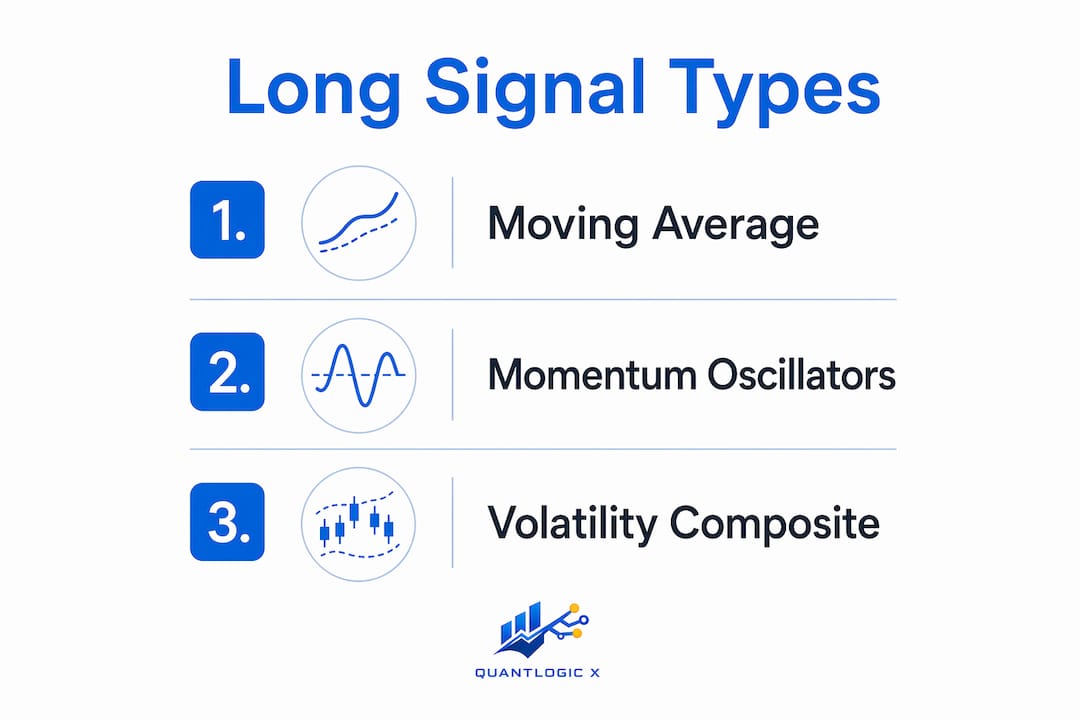
Long signal indicators fall into three broad categories, each suited to a different trading style and timeframe. Knowing which type fits your approach prevents the most common mistake in technical analysis: using a slow indicator for a fast strategy.
Moving average crossovers generate a long signal when a faster moving average crosses above a slower one, such as the 20-period EMA crossing above the 50-period EMA. These are reliable for trend investors but lag price action by design. They filter out short-term noise effectively, making them ideal for daily or weekly chart traders.

Momentum oscillators like RSI, MACD, and proprietary momentum scores react faster to price changes. They suit short-term scalpers who need to detect quick momentum shifts. The tradeoff is more frequent signals, which means more false positives without additional filtering.
Volatility-adjusted composite indicators combine trend, momentum, and volatility into one signal. These are the most sophisticated category and the most practical for active traders.
| Indicator type | Responsiveness | Best timeframe | Key risk |
|---|---|---|---|
| Moving average crossover | Low | Daily, weekly | Lags price significantly |
| Momentum oscillator | High | 1-minute to 15-minute | High false-positive rate |
| Volatility-adjusted composite | Medium | 5-minute to 4-hour | Requires proper calibration |
Matching indicator sensitivity to your trading horizon is the single most overlooked factor in indicator selection. A scalper using a slow crossover system will miss entries. A swing trader using a high-sensitivity oscillator will get shaken out of good positions by noise.
The practical differences matter beyond just speed:
- Crossover systems work best in trending markets and fail in ranges.
- Oscillators work best in ranging markets and generate false signals in strong trends.
- Composite indicators adapt to both conditions through their volatility gate, making them the preferred choice for traders who operate across multiple market environments.
How to integrate long signals into a broader trading strategy
A long signal indicator is one input, not a complete strategy. Relying on a single indicator alone is risky because no single tool accounts for all market conditions. Multi-factor confirmation setups that combine trend slope, price support levels, and momentum scores improve signal quality and reduce false positives significantly.
The integration process follows a logical sequence:
- Confirm the macro trend. Check the daily or weekly chart first. A long signal on a 15-minute chart carries more weight when the daily trend is also bullish.
- Identify key support levels. A long signal triggering at or near a major support zone has a higher probability of holding. A signal in open space between levels carries more risk.
- Check momentum alignment. Confirm that your momentum oscillator agrees with the signal. Divergence between price and momentum is a warning, not a green light.
- Apply the volatility filter. If ATR is unusually low, the market is in a compression phase. Wait for expansion before entering. If ATR is spiking abnormally, the signal may be a reaction to news rather than a genuine trend entry.
- Set stop-loss and take-profit before entering. Place your stop below the nearest support level identified in step 2. Set your take-profit at a level that achieves at least a 1.5:1 reward-to-risk ratio, consistent with professional trading standards.
- Execute and record. Log every trade with the signal conditions that triggered it. This data tells you which confirmation combinations perform best in your specific market.
Pro Tip: Systems generating fewer but higher-quality confirmed long signals tend to yield better results than high-frequency setups with minimal filtering. Patience between signals is a skill, not a weakness.
The ATR filter deserves extra attention. Volatility filtering protects capital from whipsaw losses in range-bound markets where price oscillates without direction. Disabling signals during low-ATR periods means you trade less often but with a higher success rate per trade.
Practical tips and pitfalls when using long signal indicators
The most common mistake traders make is treating a long signal indicator as a standalone decision engine. Indicators analyze price trends and momentum but are not automated profit generators. They are probability tools. The trader still makes the final call.
Repainting is the most dangerous technical pitfall. A repainting indicator shows a perfect signal on a historical bar, but that signal did not exist in real time. It appeared after the fact, once the indicator recalculated. Traders who backtest repainting indicators see inflated win rates that never materialize in live trading. The fix is simple: only use zero repaint technology that locks signals at bar close.
Timeframe mismatch is the second most common error. A long signal indicator calibrated for a 4-hour chart will generate constant false signals on a 1-minute chart. The indicator's period settings determine its sensitivity, and sensitivity must match your trading horizon.
Do's and don'ts for long signal trading:
- Do confirm signals with at least two independent factors before entering.
- Do check the broader market trend before acting on a short-term signal.
- Do use a non-repainting indicator so your backtest results reflect real historical performance.
- Don't enter a trade solely because a signal appeared. Context matters.
- Don't use the same indicator settings across all markets. Forex, crypto, and equities have different volatility profiles.
- Don't ignore volume. A long signal on declining volume is a weaker setup than the same signal on rising volume.
Treating indicators as probability enhancers rather than certainties is the mental shift that separates profitable traders from frustrated ones. The goal is not to win every trade. The goal is to win more than you lose, with enough margin to cover the losses.
Key Takeaways
A long signal indicator improves trade timing by combining trend direction, momentum confirmation, and volatility filtering into a single, reliable entry signal.
| Point | Details |
|---|---|
| Core definition | A long signal indicator identifies bullish entry points using momentum, trend, and price action analysis. |
| Non-repainting matters | Signals that lock at bar close give accurate backtests; repainting signals inflate historical win rates. |
| Multi-factor confirmation | Combining trend baseline, momentum threshold, and support levels reduces false positives significantly. |
| Timeframe alignment | Match indicator sensitivity and period settings to your specific trading horizon for best results. |
| Indicators are not guarantees | Treat every long signal as a probability input, not a certain outcome, and always apply risk management. |
Why signal quality beats signal quantity every time
Tran here. After years of watching traders burn through accounts chasing every signal that fires, I have one firm conclusion: the traders who last are the ones who wait.
Most new traders want more signals. They equate activity with progress. The reality is the opposite. A setup with three independent confirmations firing simultaneously is worth ten setups where only one condition is met. The discipline to sit on your hands until all your criteria align is harder to develop than any technical skill, and it pays more.
The non-repainting requirement is non-negotiable for me. I have seen traders build entire strategies around indicators that looked brilliant in backtesting, only to discover the signals had been rewriting themselves. That is not a minor flaw. It invalidates the entire historical record. If your indicator repaints, your backtest is fiction.
The best long signal setups I have used combine a clear trend baseline, a momentum filter that confirms buying pressure, and a volatility gate that keeps me out of choppy conditions. That combination generates fewer signals than a raw crossover system. Every one of those signals carries more weight.
— Tran
Quantlogicx: a long signal indicator built for real trading
Traders who want a long signal indicator that applies everything covered here without building it from scratch should look at what Quantlogicx has built.
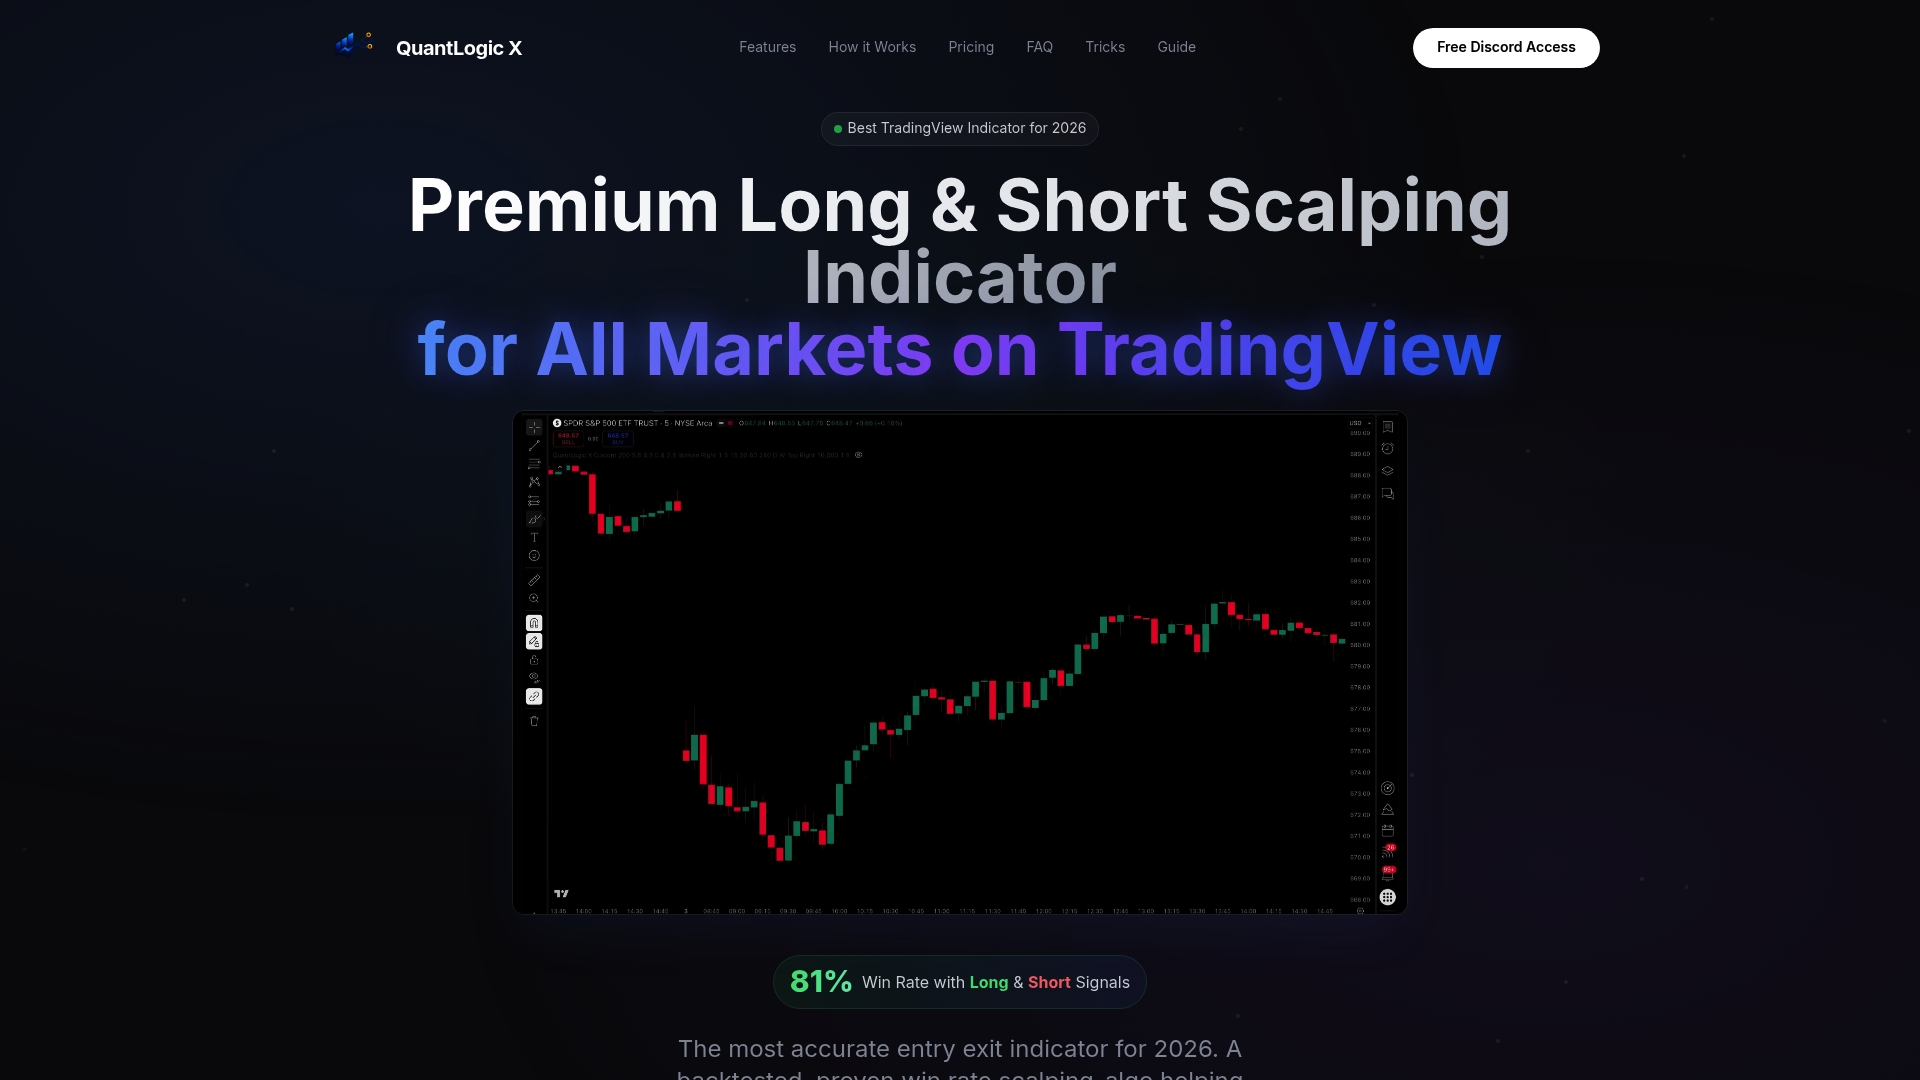
The Quantlogicx TradingView indicator uses zero repaint technology, meaning every signal locks at bar close and reflects what was visible in real time. Over 2,000 traders have used the algorithm across stocks, forex, and cryptocurrency, with the platform reporting individual gains of $8,200 within a single month. The indicator carries an 81% win rate and includes real-time alerts so you never miss a confirmed entry. For traders who want reliable buy and sell signals without building a multi-indicator system from scratch, Quantlogicx delivers a tested, ready-to-use solution.
FAQ
What is a long signal indicator in trading?
A long signal indicator is a technical tool that identifies bullish entry points by analyzing momentum, trend direction, and price action. It generates a buy signal when multiple market conditions align to suggest upward price movement is likely.
How does a long signal differ from a short signal?
A long signal tells you to buy, anticipating price will rise. A short signal tells you to sell or go short, anticipating price will fall. Both signal types use similar technical filters but trigger under opposite market conditions.
Why do non-repainting signals matter?
Non-repainting signals lock at candle close and do not move or disappear after the bar closes. Repainting signals rewrite historical data, making backtests appear far more accurate than live trading performance will ever be.
Can one indicator be enough for a long signal strategy?
Relying on a single indicator alone is risky because no single tool accounts for all market conditions. Professional setups use at least two to three confirming factors, such as trend direction, momentum score, and a key support level.
What is the best timeframe for long signal indicators?
The best timeframe depends on your trading style. Scalpers use 1-minute to 15-minute charts with high-sensitivity indicators, while swing traders use 4-hour to daily charts with slower, trend-following settings. Matching indicator sensitivity to your timeframe is critical for accuracy.