

Indicator repainting is defined as the behavior where a technical indicator revises its past or current plotted values as new price data arrives, creating discrepancies between what you saw in real time and what the chart shows afterward. This is not a minor display glitch. It is the single most common source of false confidence in backtested trading strategies. An estimated 95% of all existing technical indicators show some form of repainting behavior. That figure means nearly every indicator you have ever used carries at least some risk of showing you a signal that would not have existed in live trading. Understanding what is indicator repainting explained properly is the difference between a strategy that works on paper and one that holds up in real markets.
What causes indicator repainting and how does it affect signals?
Repainting originates from one of two technical sources: calculations on forming bars or the use of future price data. A forming bar is any candle that has not yet closed. When an indicator reads the high, low, or close of a bar that is still building, its output changes with every new tick. The signal you see at 2:47 PM may look completely different at 3:00 PM when the bar closes.

The second cause is lookahead bias. Repainting happens when indicators use data from currently forming bars or rely on future price info, causing signals to shift or recalculate as new ticks arrive. In Pine Script, this often occurs through improper use of request.security, where a script references a higher-timeframe bar that has not yet closed. The indicator reads data that does not yet exist in real time. On a historical chart, that data is already there, so the signal looks perfect.
The practical effect on your trading is serious. A buy signal that appeared at a specific price level on yesterday's chart may simply not exist when you scroll back to that bar today. The indicator recalculated and erased it. Traders who rely on those signals for backtesting are measuring a strategy that never actually existed.
There is also a distinction worth knowing: cosmetic repainting versus destructive repainting. Repainting can be benign when limited to cosmetic smoothing of moving averages on live bars, but damaging when entry and exit markers shift retrospectively. A moving average that smooths slightly as a bar closes is cosmetic. A buy arrow that disappears after the bar closes is destructive.
Pro Tip: To spot repainting quickly, open a historical chart and screenshot the signals. Reload the chart the next day and compare. If any signals moved or vanished, the indicator repaints.
Here are the main technical causes of repainting at a glance:
- Calculations referencing the current, unconfirmed bar's close or high/low
- Improper
request.securitycalls reading a forming higher-timeframe bar - Lookahead bias from future data leaking into historical calculations
- Indicators that recalculate past bars when new swing points are confirmed
- Alert triggers set to fire on every tick rather than on bar close
What are the main types of repainting indicator problems?
Not all repainting works the same way. Recognizing the type helps you decide whether an indicator is usable at all.
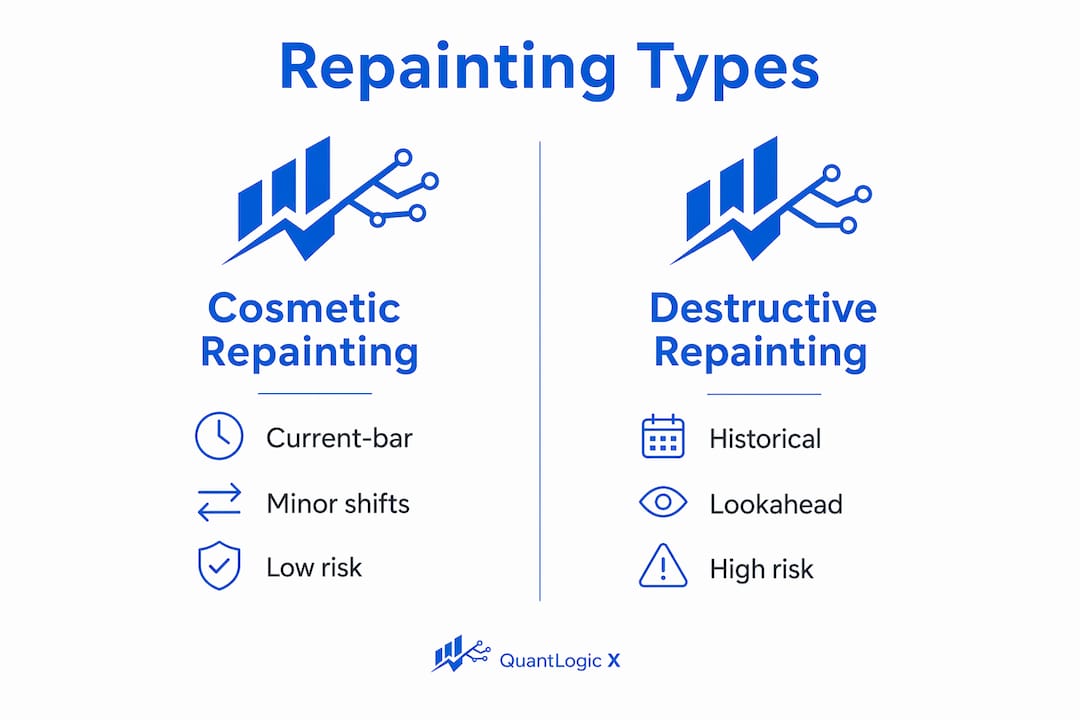
Type 1: Current-bar repainting. The signal updates continuously while the current candle is forming. This is the most common form. It is sometimes acceptable if you only act after bar close, but it creates confusion for traders who watch signals in real time.
Type 2: Historical signal repainting. Past signals on closed bars change or disappear as new data arrives. This is the most damaging type. Examples of repainting indicators include ZigZag and Williams Fractal, which alter historical signals as new data comes in. ZigZag, for instance, only confirms a swing point after the next swing forms, so every historical pivot you see was drawn after the fact.
Type 3: Lookahead repainting. The indicator uses data from a future bar to plot a signal on a past bar. This is the most deceptive type because it makes historical performance look extraordinary.
| Type | Behavior | Risk Level | Example |
|---|---|---|---|
| Current-bar repainting | Signal changes while bar forms | Medium | Most oscillators on live bars |
| Historical signal repainting | Past signals shift or disappear | High | ZigZag, Williams Fractal |
| Lookahead repainting | Future data used on past bars | Very High | Miscoded multi-timeframe scripts |
| Cosmetic repainting | Visual smoothing only, no signal shift | Low | Simple moving averages |
Some repainting indicators still offer utility when used carefully. Williams Fractal, for example, produces confirmed non-repainting signals once two bars have closed after the fractal bar. That confirmed version supports reliable backtesting. The key is knowing which version of the indicator you are using and whether it anchors signals to confirmed bars.
Non-repainting indicators anchor every signal to a completed bar. The signal appears after the bar closes and never changes. That is the standard every serious trader should demand.
How do you identify repainting indicators before trusting them?
Detection is straightforward when you know what to look for. The most reliable method is a historical comparison test.
- Screenshot your chart. Record the exact position of every signal on a historical section of the chart.
- Wait for new bars to form. Let the market run for several hours or a full session.
- Compare the signals. Reload the same historical section and check whether any signals moved, appeared, or disappeared.
- Check the script settings. In Pine Script, look for
request.securitycalls that referencebarmerge.lookahead_onor that do not use an offset to the previous closed bar. - Run a strategy tester check. If backtest results look too clean, with near-perfect entries and exits, lookahead bias is almost certainly inflating the numbers.
Effective repainting detection includes comparing indicator signals on historical charts, using bar close confirmation, and employing no-lookahead script settings. TradingView's barstate.isconfirmed function is the clearest technical signal that a developer has built the indicator correctly. When a script only fires signals on barstate.isconfirmed, it means the signal locks in only after the bar has fully closed.
Pro Tip: Set your alerts to "Once Per Bar Close" in TradingView. This single setting eliminates a large category of false signals caused by intrabar fluctuations.
The warning sign traders most often miss is a backtest that shows gains far above what the strategy's logic should produce. Repainting indicators can create misleadingly profitable backtest results by retroactively adjusting signals to future market data, inflating simulated gains up to 40%. A 40% inflation in simulated gains means a strategy that looks like a winner is actually a loser in live conditions. That gap between backtest and live performance is the clearest consequence of repainting.
You can also check indicator performance measurement methods to build a more complete verification process for any indicator you plan to trade.
Common mistakes traders make with repainting indicators
Most losses tied to repainting come from a small set of repeated errors. Recognizing them is the fastest way to stop making them.
- Trusting backtest profits without verification. Many traders underestimate repainting risk and rely on over-optimized backtests created by lookahead bias, leading to performance gaps in live trading. A backtest is only valid if the indicator's signals are anchored to closed bars.
- Confusing real-time updates with confirmed signals. Watching a signal appear on a live bar and acting on it immediately is one of the most common repainting traps. The signal has not confirmed yet.
- Ignoring script transparency. Paid indicators that do not disclose their repainting behavior are a red flag. Developers sometimes deliberately implement repainting logic to make indicators appear more accurate on static charts for sales purposes. Always ask whether the indicator uses bar close confirmation before purchasing.
- Using intrabar highs and lows for entries. Basing an entry on the high or low of a forming bar means your entry price may not be reachable once the bar closes. The signal was built on data that changed.
- Skipping the "Once Per Bar Close" alert setting. This is a configuration error, not a coding error, but it produces the same result: signals that fire on noise rather than confirmed price action.
The industry standard is clear. Traders should demand full disclosure on indicator repainting behavior and verify alerts are configured for "Once Per Bar Close" to protect signal reliability. If a developer cannot or will not tell you whether their indicator repaints, that answer is itself the answer.
How can traders reduce repainting risk in their strategies?
Reducing repainting risk does not require advanced coding knowledge. It requires a few consistent habits applied to every indicator you use.
- Require
barstate.isconfirmedin any Pine Script indicator. Anchoring calculations to the previous confirmed bar and usingbarstate.isconfirmedproduces repeatable, non-repainting signals. This is the technical standard for reliable algorithmic trading. - Use
request.securitywith proper offsets. Proper offset and lookahead flags in Pine Script, such as requesting the previous completed higher-timeframe bar, are crucial to avoid repainting in multi-timeframe indicators. The offset tells the script to read the last closed bar, not the forming one. - Wait for candle close before acting. No signal is confirmed until the bar closes. This single discipline eliminates most repainting-related losses for discretionary traders.
- Combine multiple non-repainting indicators. A signal confirmed by two or three independent non-repainting tools carries far more weight than a single indicator's output.
- Test on out-of-sample data. After backtesting, forward-test the strategy on a period of data the indicator was not optimized on. Repainting indicators collapse quickly in out-of-sample tests.
Zero repaint indicators represent the current best practice in indicator design. They lock signals at bar close and never revise historical output. Understanding the benefits of zero repaint indicators is worth the time for any trader building a rules-based strategy.
Key Takeaways
Indicator repainting is the leading cause of backtest inflation and live trading underperformance, and it is preventable by demanding bar-close confirmed signals from every indicator you use.
| Point | Details |
|---|---|
| Repainting definition | An indicator revises past or current values as new data arrives, distorting historical signals. |
| Prevalence of repainting | An estimated 95% of existing indicators exhibit some form of repainting behavior. |
| Backtest inflation risk | Repainting can inflate simulated backtest gains by up to 40%, making losing strategies appear profitable. |
| Detection method | Compare historical signals before and after new bars form; use barstate.isconfirmed in Pine Script. |
| Best practice | Only trade indicators that anchor signals to closed bars and disclose their repainting behavior. |
Why repainting cost me more than bad trades ever did
I have watched traders blow up accounts not because their market read was wrong, but because the indicator they trusted was lying to them. The signal looked perfect on the chart. The backtest showed strong results. Then live trading started and nothing matched.
The uncomfortable truth is that repainting does more psychological damage than a straightforward losing trade. A losing trade is clear. You were wrong, you move on. But a repainting indicator makes you question your own memory. You saw a signal. You took the trade. Now the signal is gone and the chart looks like you imagined it. That kind of doubt compounds over time and destroys trading discipline faster than any losing streak.
I have also noticed that traders who understand repainting deeply become far more skeptical of "too good to be true" indicators. That skepticism is healthy. Any indicator showing near-perfect historical entries deserves immediate scrutiny, not admiration. The more perfect the backtest, the more likely lookahead bias is at work.
My recommendation is simple: treat bar-close confirmation as a non-negotiable requirement, not a nice-to-have. If a developer cannot confirm their indicator uses barstate.isconfirmed or equivalent logic, do not trade it. The market will test every weakness in your setup, and repainting is the most common one.
— Tran
Quantlogicx addresses repainting with zero repaint technology
Repainting is a solvable problem, and Quantlogicx built its TradingView indicator around that exact solution.
The Quantlogicx indicator uses zero repaint technology, meaning every long and short signal locks in at bar close and never revises. Signals are anchored to confirmed bars, which means what you see on a historical chart is exactly what would have appeared in real time. Over 2,000 traders across stocks, forex, and cryptocurrency use this algorithm, with individual users recording gains of $8,200 within a single month. The indicator carries an 81% win rate and integrates real-time alerts set to bar close confirmation by default. Traders looking for a reliable TradingView indicator built without repainting can explore Quantlogicx directly at quantlogicx.com.
FAQ
What is indicator repainting in trading?
Indicator repainting is when a technical indicator changes its previously plotted values as new price data arrives, causing historical signals to differ from what appeared in real time. An estimated 95% of existing indicators exhibit some form of this behavior.
Is indicator repainting always a problem?
Not always. Cosmetic repainting, such as a moving average smoothing slightly on a live bar, is low risk. Destructive repainting, where entry or exit signals shift or disappear on closed bars, directly harms trading performance and backtest accuracy.
How do I know if an indicator repaints?
Screenshot your chart's historical signals, let new bars form, then compare. If any signals moved or vanished, the indicator repaints. In Pine Script, check whether the code uses barstate.isconfirmed and proper request.security offsets.
Can repainting indicators make backtests look better than they are?
Yes. Repainting indicators can inflate simulated backtest gains by up to 40% by retroactively placing signals at optimal price points that were not available in real time.
What is a zero repaint indicator?
A zero repaint indicator anchors every signal to a fully closed bar and never revises historical output. Signals produced at bar close remain fixed, making backtests and live performance directly comparable.