

Chart patterns in day trading are defined as recurring price formations on a chart that signal probable future price movement based on collective trader behavior. The role of chart patterns in day trading goes beyond simple shape recognition. These formations encode market psychology, reveal where buyers and sellers are fighting for control, and give traders a structured basis for timing entries and exits. Empirical research confirms that select patterns, including Bullish Harami and Hanging Man candlestick formations, carry statistically significant predictive power in volatile markets. That finding matters because it shifts chart patterns from folklore into testable, evidence-based tools. Transaction costs, market regime, and execution quality all affect how much of that edge survives in live trading.
What is the role of chart patterns in day trading?
Chart patterns serve as visual summaries of supply and demand at specific price levels. When price repeatedly bounces off the same level, a pattern forms. That pattern tells you where the market has previously agreed on value, and where it might agree again.
The most widely used patterns fall into two categories: continuation and reversal. Continuation patterns, like bull flags and ascending triangles, suggest the existing trend will resume after a brief pause. Reversal patterns, like head and shoulders or double tops, signal that the prevailing trend is losing momentum and may flip direction.

Support and resistance levels sit at the core of nearly every chart pattern. Research from the New York Fed and other institutions confirms these price levels predict intraday trend changes with measurable consistency. That institutional validation explains why professional traders treat pattern boundaries as genuine decision zones, not arbitrary lines.
Volume is the confirmation layer that separates real breakouts from traps. A breakout from an ascending triangle on heavy volume carries far more weight than the same breakout on thin volume. Without volume confirmation, the pattern is just a shape.
What are the most common chart patterns used in day trading?
The table below summarizes the key patterns day traders rely on, their typical signal type, and what they imply for trade direction.
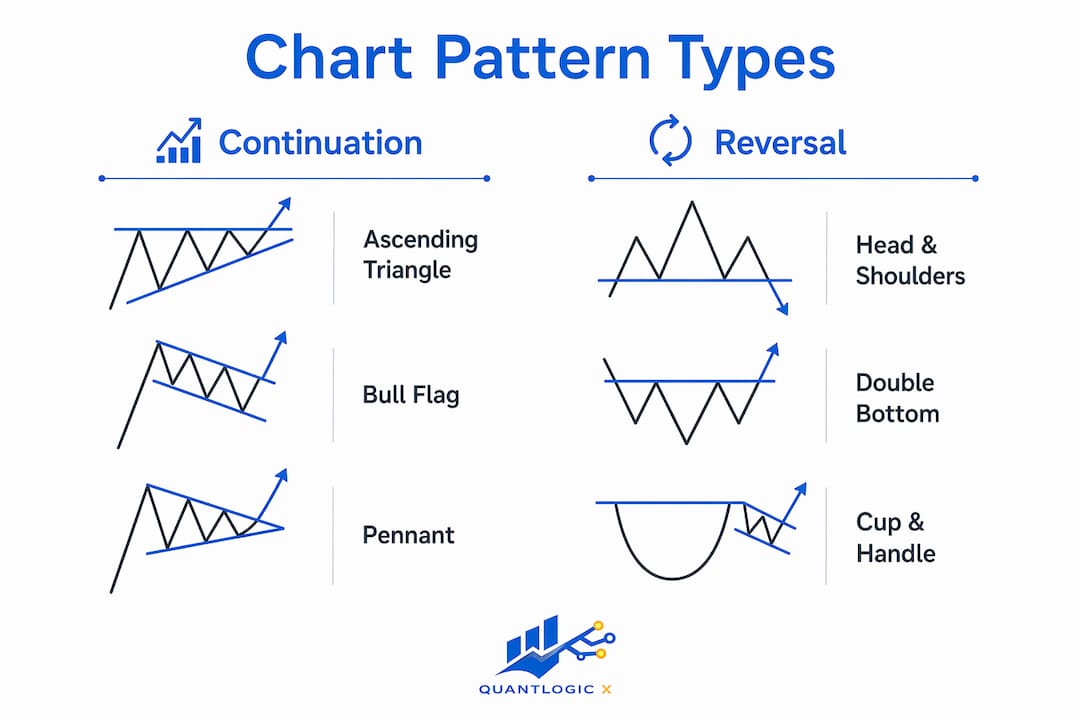
| Pattern | Signal Type | Typical Implication |
|---|---|---|
| Ascending triangle | Continuation | Bullish breakout above resistance |
| Double top | Reversal | Bearish breakdown below neckline |
| Double bottom | Reversal | Bullish recovery above neckline |
| Bull flag | Continuation | Uptrend resumes after consolidation |
| Head and shoulders | Reversal | Trend exhaustion, bearish shift |
| Inverse head and shoulders | Reversal | Bearish trend ending, bullish shift |
Each pattern carries a different probability profile depending on the market and timeframe. A bull flag on a 5-minute chart during a strong trending session behaves differently than the same pattern during choppy, low-volume midday trading.
Key factors that affect pattern reliability:
- Volume confirmation: Rising volume on a breakout validates the move. Flat or declining volume raises doubt.
- Timeframe alignment: Patterns that appear on both a 15-minute and a 1-hour chart carry more weight than those visible on only one.
- Market context: A bearish reversal pattern during a broad market selloff is more reliable than the same pattern in a rising market.
- Pattern clarity: Clean, well-defined patterns with clear boundaries outperform ambiguous formations.
Pro Tip: Never trade a pattern in isolation. Confirm it with at least one additional signal, whether that is a volume spike, a key moving average, or a broader trend alignment.
What does research say about chart pattern effectiveness?
The evidence on chart patterns is real but conditional. A study covering nearly 400 cryptocurrencies, 200 million observations across 36 exchanges from july 2018 to january 2022 found that candlestick reversal patterns like Bullish Harami and Hanging Man carry statistically significant predictive power in crypto markets. That is a large dataset, and the finding holds up under rigorous testing.
Chart patterns function partly as self-fulfilling prophecies. When enough traders recognize the same formation and act on it simultaneously, their collective behavior creates the very price move the pattern predicted. This reflexivity effect is strongest in volatile, less efficient markets like cryptocurrency, and weakest in highly liquid, institutionally dominated markets where algorithmic trading dominates.
The self-fulfilling dynamic has a ceiling, though. Pattern popularity can degrade reliability over time. As more traders recognize and trade the same setup, the edge shrinks because the market prices it in faster. Head and shoulders, arguably the most famous reversal pattern, is now so widely known that sophisticated participants often fade the obvious breakout, creating false signals for retail traders who act too late.
Hindsight bias is the other major trap. Patterns look obvious in retrospect on a clean chart. In real time, with price moving tick by tick and news hitting the tape, the same formation is far harder to identify with confidence. False breakouts and stop hunts are common, particularly around key support and resistance levels where stop orders cluster.
Transaction costs compound the problem. Slippage and spread erode theoretical returns from intraday patterns like bull flags and triangles. A pattern with a theoretical 55% win rate may produce a net loss once realistic execution costs are factored in. Most backtests ignore this, which is why live results so often disappoint.
Pro Tip: Before trading any pattern live, run a backtest that includes realistic spread and slippage estimates for your specific market and time of day. A pattern that looks profitable on paper may break even or lose money after costs.
How can day traders effectively incorporate chart patterns into their strategies?
Effective pattern trading requires a structured process, not just pattern spotting. The following approach reflects how experienced intraday traders build reliable setups.
-
Identify the market regime first. Trending markets favor continuation patterns like flags and triangles. Ranging markets favor reversal patterns like double tops and bottoms. Trading a continuation pattern in a choppy, directionless market is a common and costly mistake.
-
Use multi-timeframe confluence. Multi-timeframe confirmation increases pattern reliability significantly. If a bull flag appears on a 5-minute chart and the 30-minute chart shows a clear uptrend, the probability of a successful breakout rises. Acting on a pattern that contradicts the higher timeframe trend is a low-probability trade.
-
Wait for volume confirmation before entry. Volume spikes at the breakout point separate genuine moves from false ones. Entering before volume confirms the breakout is speculation, not pattern trading.
-
Set stops based on pattern structure, not dollar amounts. Place your stop just beyond the pattern boundary. A double bottom stop goes below the second bottom. A bull flag stop goes below the flag's lower trendline. This approach ties risk directly to the pattern's invalidation point.
-
Avoid low-liquidity windows. The first 15 minutes and the last 30 minutes of a session often produce erratic price action. Spreads widen, slippage increases, and patterns fail more frequently. Experienced traders focus on the core session hours when liquidity is deepest.
-
Use technology to reduce reaction time. Tools like the Quantlogicx TradingView indicator help traders spot pattern-based signals faster and with greater consistency, reducing the cognitive load of real-time pattern recognition. Faster identification means better entry prices and tighter risk control.
A disciplined daily routine reinforces all of these steps. Traders who review their pattern trades systematically improve faster than those who trade reactively without a structured review process.
What are common pitfalls and misconceptions about chart patterns?
Most pattern trading mistakes come from misunderstanding what patterns actually are. They are probabilistic signals, not certainties. Treating them as guarantees is the single most damaging error a day trader can make.
Common pitfalls that hurt performance:
- Ignoring market context. A head and shoulders pattern during a Federal Reserve announcement day behaves differently than the same pattern on a quiet Tuesday. News flow, order flow, and cross-market conditions all affect outcome. Market regime and context determine whether a pattern performs as expected.
- Inconsistent pattern definitions. Two traders looking at the same chart often see different patterns. Without a clear, written definition of what qualifies as a valid setup, pattern trading becomes subjective and unrepeatable.
- Overtrading on too many signals. More signals mean more transaction costs. Each trade carries spread, slippage, and commission. A trader taking 20 marginal pattern trades a day often underperforms one who takes 4 high-conviction setups.
- Treating backtested win rates as guarantees. Win rate claims without context are meaningless. A 70% win rate with a 1:0.5 reward-to-risk ratio loses money over time. Always evaluate win rate alongside average win size and average loss size.
- Chasing the breakout. Entering after a pattern has already broken out and moved significantly reduces the reward-to-risk ratio. The best entries come at or just above the breakout point, not after a 2% move has already occurred.
Retail traders who place limit orders at technical levels achieve a 60% fill rate versus under 3% overall on the NYSE. That statistic shows that disciplined, level-based execution produces meaningfully better results than chasing price.
Key Takeaways
Chart patterns are probabilistic tools grounded in market psychology, and their effectiveness depends entirely on context, confirmation, and disciplined execution.
| Point | Details |
|---|---|
| Patterns are probabilistic, not certain | Treat every pattern as a hypothesis that requires volume and context confirmation before acting. |
| Empirical research supports select patterns | Candlestick patterns like Bullish Harami show statistically significant predictive power in crypto markets. |
| Transaction costs reduce real-world edge | Slippage and spread erode theoretical returns; always backtest with realistic cost assumptions. |
| Confluence improves reliability | Multi-timeframe alignment and volume spikes filter out false breakouts and raise win probability. |
| Overtrading destroys profitability | Fewer, higher-conviction setups outperform high-frequency pattern trading once costs are factored in. |
Why I think most traders misuse chart patterns
After years of watching traders work through pattern-based strategies, the clearest pattern I see is this: most traders use chart patterns as a crutch for certainty in an uncertain environment. They want the pattern to tell them what will happen. That is the wrong frame entirely.
Chart patterns are diagnostic tools. They describe what the market has done and suggest what it might do next, given similar conditions. The moment you treat a head and shoulders as a guarantee of a reversal, you stop thinking and start hoping. That is when the market takes your money.
The traders I have seen succeed with patterns treat them as one input among several. They check the broader trend. They watch volume. They note whether the pattern is forming near a key level or in the middle of nowhere. They ask whether the pattern makes sense given what the market is doing across related assets.
Technology has genuinely changed pattern recognition. Tools that flag setups in real time reduce the cognitive load of scanning multiple charts simultaneously. But technology does not replace judgment. A signal from an indicator still needs a trader who understands why the pattern matters in that specific context.
My honest warning: be skeptical of any marketing that promises a fixed success rate for a specific pattern. The research is clear that pattern profitability depends on definitions, timeframes, and market conditions. Backtest your own setups, track your results honestly, and let the data tell you which patterns actually work in the markets you trade.
— Tran
How Quantlogicx supports pattern-based day traders
Pattern recognition is only as good as the speed and accuracy of your execution. Quantlogicx built its TradingView indicator specifically for traders who need reliable signals without the noise of traditional tools.
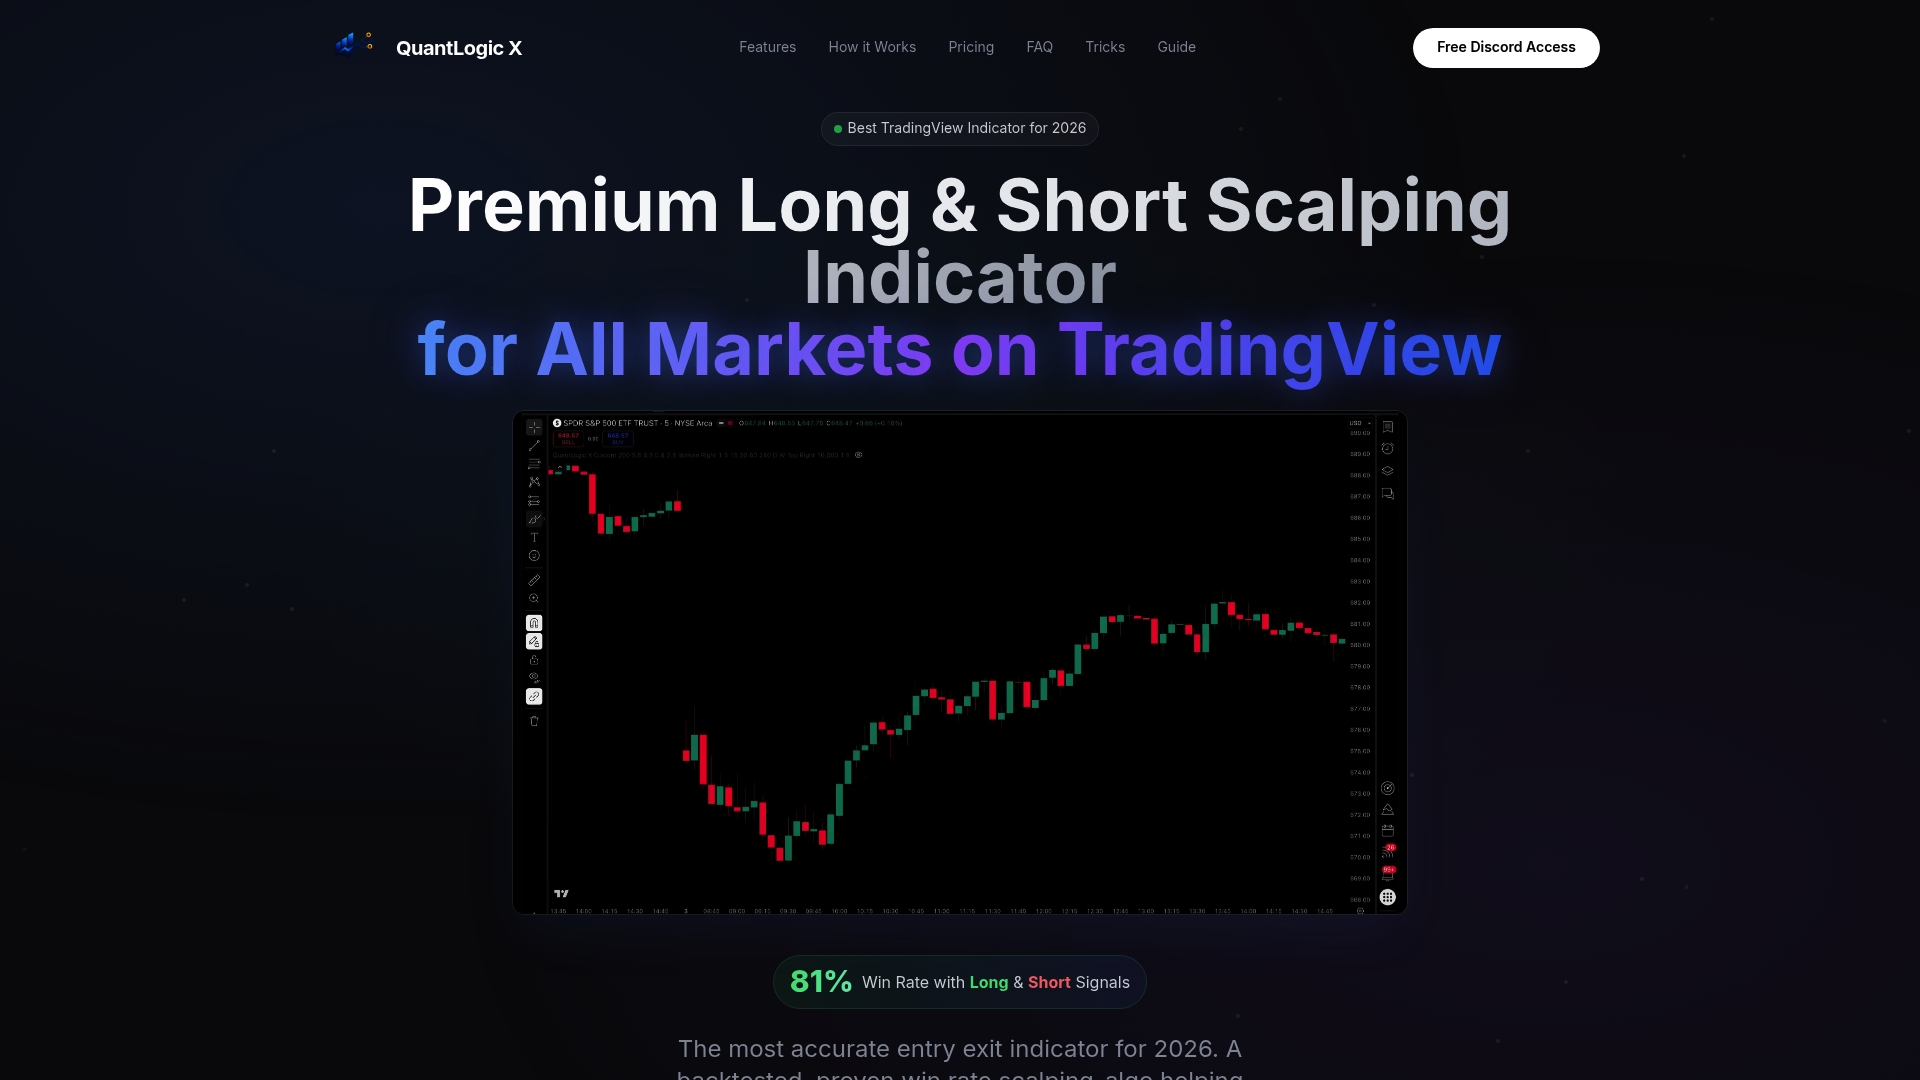
The Quantlogicx indicator uses zero repaint technology, meaning every long and short signal is locked in at bar closure. Over 2,000 traders across stocks, forex, and cryptocurrency use it to confirm pattern setups with real-time alerts, reducing the guesswork of manual chart reading. One user recorded $8,200 in gains within a single month by combining the indicator's signals with structured pattern-based entries. The platform also includes a community where traders share setups and results, which accelerates learning for both beginners and experienced traders refining their edge.
FAQ
What is the primary role of chart patterns in day trading?
Chart patterns identify recurring price formations that signal probable trend continuations or reversals, giving day traders a structured basis for timing entries and exits at key support and resistance levels.
Are chart patterns reliable enough to trade on their own?
Chart patterns are not reliable as standalone signals. Profitability depends on specific definitions, timeframes, and execution methods, and patterns perform best when confirmed by volume and broader market context.
Which chart patterns work best for beginners in day trading?
Bull flags and double bottoms are the most beginner-friendly patterns because they have clear, well-defined boundaries and straightforward entry and stop placement rules. Start with one pattern, master it, and expand from there.
How do transaction costs affect chart pattern trading?
Slippage and spread erode theoretical returns from intraday patterns, particularly in fast-moving markets. Always factor realistic execution costs into any backtest before trading a pattern live.
Can chart patterns predict price with certainty?
Chart patterns cannot predict price with certainty. They are probabilistic signals that reflect collective trader behavior, and the same pattern can succeed or fail depending on market regime, news flow, and liquidity conditions.