

Verified trading signals are pre-analyzed trade recommendations validated through independent performance auditing and rigorous statistical testing. The role of verified signals in trading goes far beyond simple buy and sell alerts. A genuine verified signal includes entry price, exit target, stop-loss level, and risk parameters, all confirmed against live market data across multiple conditions. Industry standards like the Walk Forward Ratio, Sharpe ratio, and drawdown consistency scoring now define what separates a trustworthy signal from a marketing claim. Quantlogicx, for example, builds its TradingView indicator around zero repaint technology, meaning signals lock in at bar closure and cannot be retroactively altered. That commitment to signal integrity is exactly what the market demands in 2026.
What is the role of verified signals in trading?
Verified signals are defined as trade alerts that have passed independent performance validation, not just backtested by the provider. The distinction matters because self-reported results are easy to manipulate. A provider can cherry-pick winning trades, exclude losing periods, or optimize parameters so tightly to historical data that the signal collapses in live markets.
The Walk Forward Ratio is the clearest quantitative test for signal durability. A ratio above 0.5 indicates the signal holds up outside its training data. A ratio below 0.3 signals overfit, meaning the strategy was tuned to past noise rather than real market structure. That single metric filters out a large share of signals that look impressive on paper but fail in practice.

Professional traders do not stop at the Walk Forward Ratio. They apply composite scorecards that combine the Sharpe ratio, drawdown consistency, and execution fill rate. Each component catches a different failure mode. Sharpe ratio measures return per unit of risk. Drawdown consistency shows whether losses cluster dangerously or spread evenly. Fill rate confirms that the signal is executable at the stated price, not just theoretical.
The importance of trading signals lies in what they replace: hours of manual chart analysis, emotional guesswork, and inconsistent execution. A verified signal compresses that work into a single, audited recommendation. Traders who use verified signals consistently report faster decision cycles and fewer impulsive trades.
How to assess signal quality before you trade
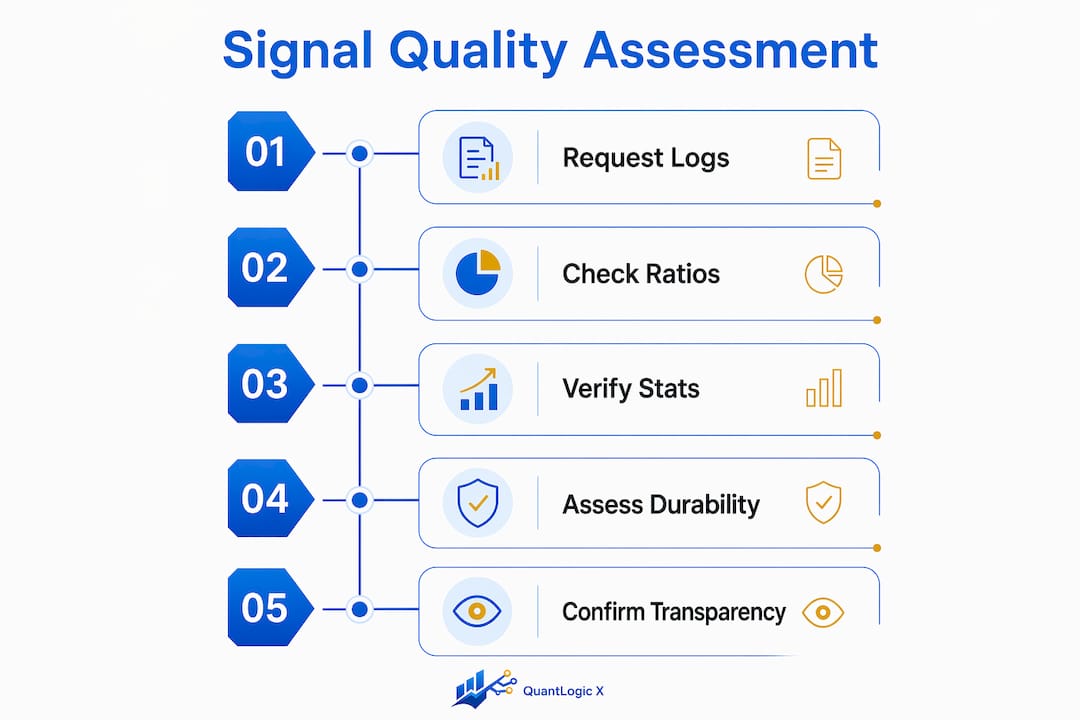
| Evaluation Criterion | What It Measures | Threshold to Look For |
|---|---|---|
| Walk Forward Ratio | Out-of-sample durability | Above 0.5 |
| Sharpe Ratio | Risk-adjusted return | Above 1.0 preferred |
| Drawdown Consistency | Loss distribution pattern | Even, not clustered |
| Execution Fill Rate | Real-world executability | As close to 100% as possible |
| Trade History Completeness | Transparency and auditability | All trades, timestamped |
Pro Tip: Request the full trade log, not a summary. A credible provider gives you timestamped entries and exits for every trade, including the losers. Anything less is a red flag.
Check the scalping signal checklist for a practical framework that applies these criteria to fast-moving markets.
What are the biggest misconceptions about trading signal verification?
The most dangerous misconception in trading is that a high win rate equals profitability. A system with a 70% win rate can lose money consistently if the average losing trade is three times larger than the average winner. Win rate alone tells you nothing about expectancy, which is the true measure of whether a signal makes money over time.
Expectancy is calculated as: (Win Rate × Average Win) minus (Loss Rate × Average Loss). A signal with a 55% win rate and a 2:1 reward-to-risk ratio outperforms a 70% win rate signal with a 1:2 reward-to-risk ratio every time. Traders who skip this calculation often chase signals that feel good but drain accounts slowly.
The second major misconception is that a provider's own verification counts as independent verification. No signal provider is self-verifying. True verification requires access to raw signal data so a third party can run the expectancy calculation independently. Without that access, performance claims are unverifiable by definition.
"Raw performance archives including all signals with timestamped entries and exits are the gold standard to detect cherry-picking and false performance claims. Any provider unwilling to share this data is asking you to trust a claim they cannot prove."
Common warning signs of dubious signal providers include:
- Win rates advertised without average loss figures
- Backtests that cover only bull market periods
- No third-party audit or independently verified track record
- Signals that change retroactively after the bar closes (repaint)
- Performance screenshots instead of exportable trade logs
Repainting is particularly insidious. A signal that repaints appears accurate on historical charts because it rewrites itself to match past price action. In live trading, the signal fires at one level and then shifts, leaving the trader with a false entry. Quantlogicx addresses this directly with zero repaint technology, locking signals at bar closure so the historical chart matches exactly what traders saw in real time.
How do you integrate verified signals into your trading strategy?
Verified signals work best when they are one input in a structured decision process, not the entire process. Traders who treat signals as automatic orders remove the judgment layer that protects against unusual market conditions. The goal is disciplined execution guided by verified data, not blind automation.
A practical integration framework follows four steps:
- Confirm the signal against current market conditions. Check whether volatility and liquidity align with the signal's historical performance environment. Meta-cognitive layers that assess real-time market environment improve decision-making about whether to trust a signal at any given moment.
- Apply your risk parameters before entering. Set position size based on your account's maximum drawdown tolerance, not the signal provider's default. A signal is only as good as the risk management wrapped around it.
- Use confirmation techniques from your own analysis. Volume confirmation, support and resistance alignment, and trend direction checks all add a second layer of validation. A verified signal that also aligns with your own read of the chart carries significantly more weight.
- Audit your signal performance monthly. Track which signals you took, which you skipped, and why. This creates a feedback loop that sharpens your judgment about when a signal fits your strategy and when it does not.
Pro Tip: Keep a signal journal separate from your trade journal. Record the signal's stated parameters, your entry, and the outcome. After 30 trades, patterns emerge that tell you whether the signal fits your market and timeframe.
The ways to measure trading indicator performance guide covers the statistical consistency checks that belong in any monthly audit.
Due diligence on signal providers should cover three non-negotiable areas: full trade history transparency, independent audit confirmation, and a clear explanation of how the signal is generated. Providers who cannot answer all three questions clearly are not worth your capital.
How are technology and regulation reshaping verified signals in 2026?
AI ensemble models now define the frontier of signal verification. These systems require consensus among multiple independent algorithms before generating a signal. AI ensemble models reduce false positives by demanding agreement across diverse methods rather than relying on a single model's output. Human review sits on top of that consensus layer, catching edge cases that statistical models miss.
The regulatory environment has hardened in parallel. ESMA requires firms to perform conformance and stress testing on all algorithmic trading systems to confirm they can withstand volatility spikes and high order volumes. That requirement pushes signal providers toward the same standards that institutional trading desks have used for years.
Regulatory bodies also increasingly require real-time monitoring and kill-switch capabilities to prevent disorderly trading triggered by algorithmic signals. A kill switch halts signal generation automatically when predefined risk thresholds are breached. Cooldown windows and human-in-the-loop escalation protocols add further layers of control in high-frequency environments.
| Regulatory or Technical Control | Purpose | Who It Protects |
|---|---|---|
| Conformance testing | Validates signal behavior under stress | Traders and markets |
| Real-time monitoring | Detects anomalies as they happen | Brokers and regulators |
| Kill-switch mechanism | Stops runaway signal generation | All market participants |
| AI ensemble consensus | Reduces false positive signals | Individual traders |
| Timestamped audit logs | Enables independent verification | Traders and compliance teams |
For traders choosing a signal service, these controls are selection criteria, not background details. A provider that cannot describe its stress testing process or explain how it handles signal failures in volatile markets is operating below the standard that regulators and professional traders now expect. The fintech workflow optimization frameworks emerging from regtech show how conformance testing integrates into live trading operations at scale.
Key Takeaways
Verified trading signals deliver consistent value only when evaluated through independent auditing, quantitative scorecards, and disciplined integration into a risk-managed strategy.
| Point | Details |
|---|---|
| Walk Forward Ratio is the durability test | A ratio above 0.5 confirms a signal holds up outside its training data. |
| Win rate alone misleads traders | Expectancy calculation, not win rate, determines whether a signal is actually profitable. |
| Independent verification is non-negotiable | Providers must supply timestamped raw trade logs for third-party auditing. |
| Real-time market context improves signal trust | Meta-cognitive assessment of volatility and liquidity sharpens entry decisions. |
| Regulatory standards now set the baseline | ESMA conformance testing and kill-switch requirements define minimum signal provider accountability. |
Why I think most traders misuse verified signals
Most traders treat signal verification as a one-time trust decision. They check a provider's track record once, decide it looks credible, and then follow signals passively for months. That approach fails because markets change and signal performance degrades when conditions shift outside the historical range the signal was built on.
The traders I have seen succeed with verified signals treat verification as an ongoing process. They run monthly audits, track their own execution against the signal's stated parameters, and adjust position sizing when a signal's recent performance diverges from its historical baseline. That discipline is what separates traders who use signals well from those who blame the signal when results disappoint.
The other mistake I see constantly is ignoring the fill rate component of signal quality. A signal that works perfectly at the stated entry price but requires execution within a two-second window is not a practical signal for most traders. Slippage and latency eat the edge. Always test whether you can actually get filled at the signal's price before committing real capital.
Signal verification is not about finding a perfect signal. It is about building a process that tells you, in real time, whether a given signal is worth acting on today. That process, applied consistently, is the actual competitive edge.
— Tran
Quantlogicx: verified signals built for active traders
Traders who want independently verifiable signals without building their own audit framework have a direct path forward with Quantlogicx.
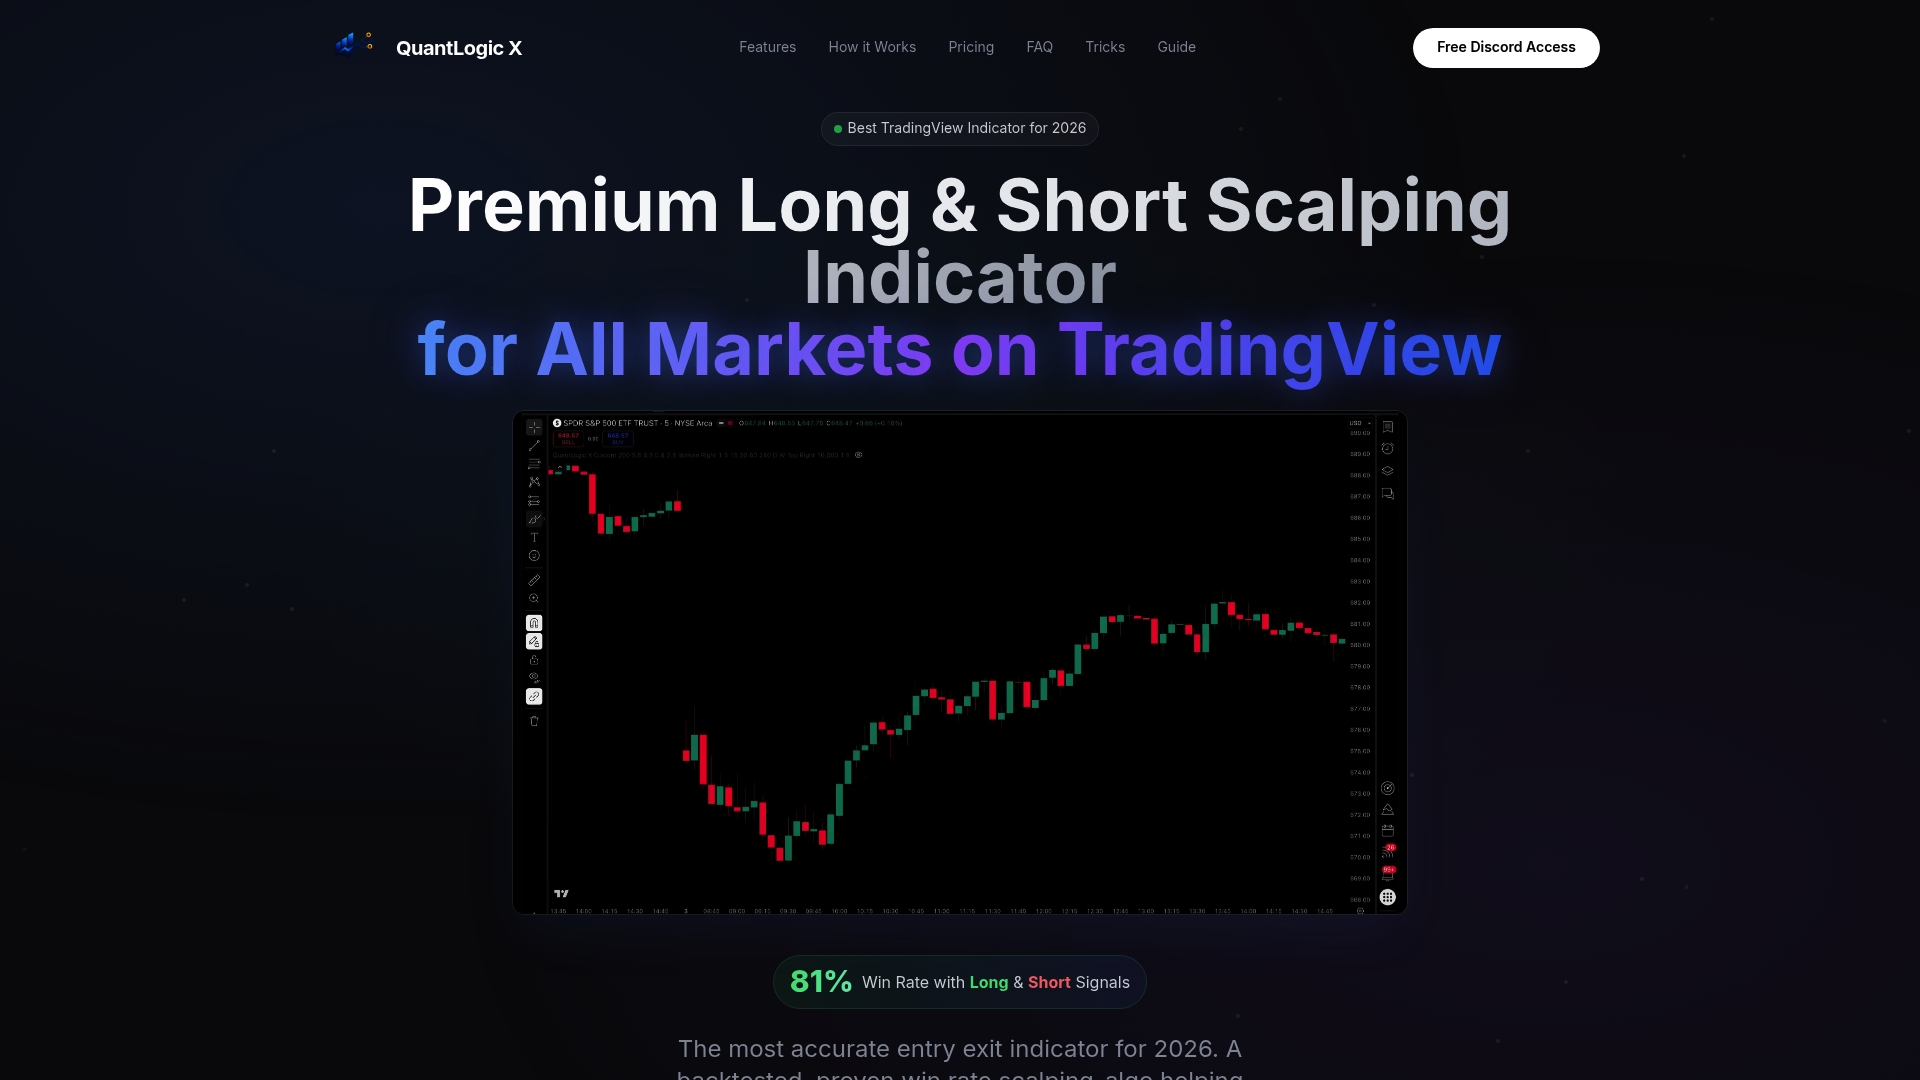
Quantlogicx's TradingView indicator generates long and short signals with zero repaint technology, meaning every signal you see on a historical chart is exactly what fired in real time. Over 2,000 traders use the algorithm across stocks, forex, and cryptocurrency, with documented gains including $8,200 in a single month for individual users. The indicator reports an 81% win rate backed by a transparent track record. Explore the verified buy and sell signals and see how the tool's built-in risk parameters support the kind of disciplined, signal-based trading this article describes. For traders focused on crypto markets specifically, the crypto indicator page covers market-specific applications.
FAQ
What are verified trading signals?
Verified trading signals are trade recommendations validated through independent auditing, timestamped trade logs, and quantitative performance metrics. They include entry, exit, and risk parameters confirmed against live market data across multiple market conditions.
How do I use the Walk Forward Ratio to evaluate a signal?
A Walk Forward Ratio above 0.5 indicates the signal performs well outside its training data. A ratio below 0.3 suggests the strategy was overfit to historical data and is likely to fail in live trading.
Why is win rate a misleading metric for signal quality?
A 70% win rate can still produce consistent losses if average losing trades are significantly larger than average winners. Expectancy calculation, which weighs both win rate and average trade size, gives a more accurate picture of profitability.
What does zero repaint mean in a trading signal?
Zero repaint means the signal locks in at bar closure and cannot change retroactively. This guarantees that the historical chart reflects exactly what traders saw in real time, making backtesting results trustworthy.
What regulatory standards apply to algorithmic trading signals in 2026?
ESMA requires conformance testing, stress testing, real-time monitoring, and kill-switch mechanisms for all algorithmic trading systems operating in the EU. These standards now define the minimum accountability threshold for professional signal providers.