

Multi-timeframe scalping strategy uses three distinct chart timeframes simultaneously: one for trend context, one for pattern setup, and one for precise entry timing. The result is a layered decision framework that filters out noise, aligns your bias with the broader market, and sharpens your entries to the second. If you've been scalping off a single chart and wondering why your win rate stays inconsistent, this is the fix.
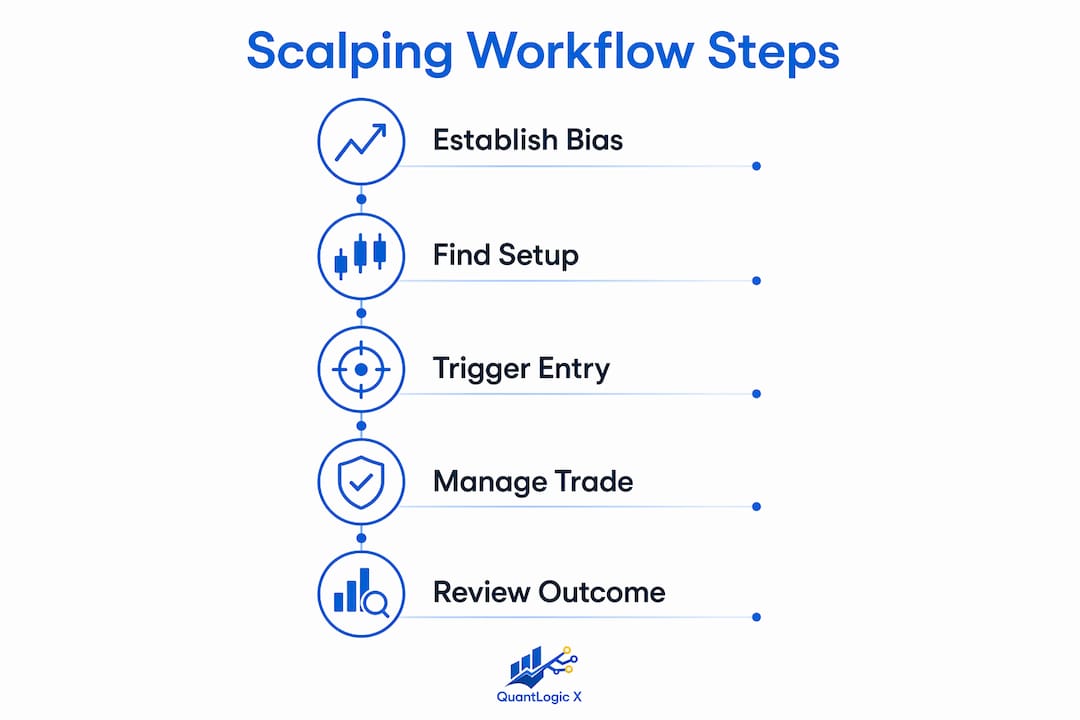
The core structure looks like this: a higher timeframe (say, 15-minute or 1-hour) establishes directional bias, a middle timeframe (5-minute) identifies the pattern or setup forming within that trend, and the lowest timeframe (1-minute) triggers the actual entry. Each chart has one job. None of them do double duty.
Key benefits at a glance:
- Reduced false signals by requiring alignment across multiple timeframes before entry
- Better entry timing through execution-level precision on the lowest chart
- Stronger directional conviction anchored to higher timeframe structure
- Cleaner stop placement using structural levels from the signal timeframe, not execution noise
- Lower emotional interference because the bias is set before you ever touch the execution chart
Table of Contents
- What is a multi-timeframe scalping strategy and why does it work?
- How do you read and coordinate signals across timeframes?
- How do you actually implement a multi-timeframe scalping setup?
- What mistakes do traders make with multi-timeframe scalping?
- What advanced methods sharpen multi-timeframe scalping further?
- How does Quantlogicx support multi-timeframe scalping?
- Quantlogicx: your edge in multi-timeframe scalping
- Key Takeaways
- FAQ
What is a multi-timeframe scalping strategy and why does it work?
The foundation of any multi-timeframe analysis approach is a simple but powerful idea: the same asset tells a different story depending on the timeframe you're watching. A 5-minute chart might show a sharp downward move that looks like a reversal. Zoom out to the 1-hour, and that same move is a routine pullback inside a strong uptrend. Without the higher timeframe context, you'd short into a trend that's about to resume upward.
For scalpers, this matters more than for any other trading style. Scalping margins are thin. One bad entry against the trend doesn't just cost a trade; it can wipe out three winners. Multi-timeframe analysis is the structural defense against that.
The 4–6x spacing rule
Timeframe spacing is where most traders get this wrong. Each timeframe in your stack should be roughly 4–6 times larger than the one below it. A 1-minute and a 3-minute chart are too close together; they show nearly identical data with minor lag differences. That's not analysis, that's redundancy. The 4–6x rule prevents analysis paralysis by keeping each chart genuinely distinct, so every level of your stack adds new information.
Practical scalping stacks that follow this rule:
- 30-min / 5-min / 1-min: The classic scalper-friendly combo. The 30-minute sets trend direction, the 5-minute identifies the setup, and the 1-minute nails the entry.
- 1-hour / 15-min / 5-min: Slightly wider context, better for volatile sessions or news-driven markets.
- 15-min / 5-min / 1-min: Works for very active intraday scalpers who need faster context shifts.
Context chart, setup chart, execution chart
These three roles are fixed. The context chart is never used for entries. The execution chart is never used for structural analysis. Mixing those roles is where traders create confusion and start second-guessing setups that were actually valid.
"The highest timeframe is the 30,000-foot view. This is your trend, your overall market sentiment. The lowest timeframe is a street-level view. This is where traders time entries and exits with greater precision." — TakeProfitTrader
Essential fundamentals checklist:
- Set directional bias on the highest timeframe before opening the execution chart
- Never trade a lower timeframe signal that contradicts the higher timeframe trend
- Keep your stack to three charts maximum; more creates information overload
- Use the middle timeframe to confirm a setup is forming, not to find new bias
- Treat the execution chart as a trigger tool only, not a structural analysis tool
How do you read and coordinate signals across timeframes?
Signal coordination is the skill that separates profitable scalpers from consistent losers. The goal isn't just to have three charts open; it's to require agreement across them before committing capital.
When all three timeframes point the same direction, that's your highest-probability trade. The top-down approach means the higher timeframe always holds authority. A bullish 1-minute signal means nothing if the 15-minute is in a clear downtrend. You don't override the higher timeframe; you wait for it to align.
Alignment vs. divergence
Full alignment looks like this: the 1-hour chart shows higher highs and higher lows, the 15-minute shows a pullback to a key EMA that's holding, and the 5-minute prints a bullish engulfing candle at that level. All three agree. That's your entry.
Divergence looks like this: the 1-hour is bullish, but the 15-minute has broken its short-term structure to the downside and the 5-minute is making lower lows. Two timeframes are conflicting. The right move is to wait, not force a trade.
"When timeframes conflict, the safest action is to not trade that stock and wait for a setup where all timeframes align. Conflicting timeframes mean the market itself is undecided." — DayTradingToolkit
Practical indicator alignment
EMA and VWAP combinations are the workhorses of multi-timeframe scalping. A 9-period EMA crossing above a 21-period EMA on the 5-minute chart is a bullish cue, but only when the 1-hour EMA is also trending upward. VWAP adds a session-level fair value anchor. When price pulls back to VWAP on the 5-minute and the 1-hour trend is intact, that confluence is a high-probability entry zone.
Signal coordination principles:
- Require at least two timeframes to confirm trend direction before looking at the execution chart
- Use the same indicator on all three charts so you're comparing apples to apples
- When the 1-hour and 15-minute agree but the 5-minute hasn't triggered yet, wait for the trigger rather than anticipating it
- Reduce position size by 50% when only two of three timeframes align; skip the trade entirely when only one does
- Volume confirmation on at least two timeframes strengthens any entry signal significantly
How do you actually implement a multi-timeframe scalping setup?
Here's a concrete, repeatable workflow. Say you're scalping a large-cap stock in the first hour of the session.
Step 1: Establish bias on the highest timeframe. Open the 15-minute or 1-hour chart. Identify the trend: is price making higher highs and higher lows, or the reverse? Mark key support and resistance zones. This chart sets your directional filter for the entire session. You will only take trades in this direction.

Step 2: Find the setup on the middle timeframe. Drop to the 5-minute chart. Look for price approaching one of the levels you marked on the higher timeframe. Is there a pattern forming? A flag, a pullback to the 9 EMA, a VWAP test? This is where you identify what you're trading, not yet when.

Step 3: Trigger on the execution chart. Move to the 1-minute chart only when the 5-minute setup is nearly complete. Wait for a specific trigger: a bullish engulfing candle, an EMA crossover, a break of a short-term consolidation. No trigger, no trade.
Step 4: Place your stop at the signal timeframe's invalidation level. This is critical. Stop loss placement belongs at the 5-minute chart's structural low (for longs), not the 1-minute chart's noise. A stop placed on the execution chart is almost always too tight and gets hit by normal volatility before the trade has a chance to work.
Step 5: Set your target using higher timeframe resistance. The next significant level on the 15-minute or 1-hour chart is your profit target. Don't let a 5-minute chart's "room to run" tempt you into holding past a major higher timeframe resistance zone.
"A major resistance level on the 4-hour chart can be a logical area to take profits, even if the 15-minute chart looks like it has more room to run." — TakeProfitTrader
Practical trade management checklist:
- Risk a fixed percentage per trade (typically 0.25–1% of account equity)
- Size the position so the distance to your stop equals that fixed dollar risk
- Set a hard daily loss limit (2–3 losing trades or a fixed dollar amount) and stop when you hit it
- Target 1.5–2x your risk where possible; a positive risk-to-reward ratio combined with a 60%+ win rate produces positive expectancy
- Take profit decisively; scalps die when you let a winner round-trip to your entry
Pro Tip: Write your directional bias on paper before opening the execution chart. This one habit prevents the most common scalping error: letting 1-minute price action talk you out of a setup that was valid on every higher timeframe.
Check out these scalping profit setups for concrete examples of how these steps play out across different market conditions.
What mistakes do traders make with multi-timeframe scalping?
The errors in multi-timeframe scalping are remarkably consistent. Knowing them in advance is the fastest way to skip the expensive learning curve.
Over-monitoring the execution chart. Staring at the 1-minute chart for extended periods causes emotional trading. Every tick looks meaningful. Premature exits become the norm. The execution chart is a trigger tool; once you're in a trade, manage it from the signal timeframe (5-minute), not the 1-minute.
Choosing timeframes that are too close together. A 5-minute and 10-minute chart don't give you two perspectives; they give you the same perspective with a slight delay. Timeframes spaced closer than 4x apart produce redundant signals that create false confidence in a setup that's really just one data point viewed twice.
Trading lower timeframe signals against the higher timeframe trend. This is the most expensive mistake in scalping. The 1-minute chart might show a textbook bullish setup, but if the 15-minute is in a clear downtrend, that long is fighting the dominant force in the market. Even when it works occasionally, the risk-to-reward is structurally poor.
Common mistakes that kill scalping consistency:
- Analysis paralysis from watching too many charts simultaneously
- Switching timeframe combinations between sessions, destroying any feel for how the charts behave
- Using the context chart to find entries instead of just setting bias
- Ignoring volume confirmation, which separates real breakouts from fakeouts
- Skipping the pre-trade bias write-down and letting execution-chart noise set direction
- Taking trades when only two of three timeframes agree, treating partial alignment as full confirmation
Pro Tip: After setting your bias on the 1-hour chart, minimize it. Keep only the 5-minute and 1-minute charts visible during active trading. The 1-hour has done its job; watching it during execution only invites second-guessing.
For a deeper look at how entry timing affects scalping outcomes, the mechanics behind these mistakes become even clearer.
What advanced methods sharpen multi-timeframe scalping further?
Once the three-chart framework is second nature, there are several ways to add precision without adding complexity.
Elliott Wave Theory integration. Wave counts on the higher timeframe tell you where you are in the larger market structure. Entering a scalp at the start of a Wave 3 on the 15-minute chart, confirmed by a 5-minute setup, puts you in the highest-momentum segment of a move. The wave count doesn't replace the multi-timeframe stack; it adds structural context to the context chart.
Momentum oscillator confirmation. A stochastic oscillator (5,3,3 settings work well for scalping) on the 5-minute chart that's rising from the oversold zone while the 1-hour trend is bullish adds a second independent confirmation layer. When the EMA crossover, VWAP test, and stochastic reversal all align on the setup chart, the probability of a successful scalp increases meaningfully.
Layered stop loss and profit targets. Rather than a single stop, some experienced scalpers use a two-level approach: an initial stop at the 5-minute structural low, with a mental stop at the 1-hour structural low for a small portion of the position. This allows partial survival of a deeper pullback while protecting the majority of the position from noise.
Zero-repaint indicators and real-time alerts. Repainting indicators are particularly dangerous for scalpers because they show signals that disappear after the fact, creating a false historical record. Zero-repaint technology locks signals at bar close, giving you a reliable audit trail and preventing the illusion of a better win rate than you actually have.
Advanced tips for superior scalping outcomes:
- Match your timeframe stack to your natural hold duration; if you hold for 2–5 minutes, the 30-min/5-min/1-min stack fits better than a 4-hour/1-hour/15-min stack
- Use confirmed breakout patterns (flags, pennants) on the setup chart rather than anticipating breakouts
- Apply VWAP as a session-level filter; trades in the direction of VWAP trend have higher institutional backing
- Review your trades on the signal timeframe (5-minute) after the session, not the execution timeframe, to evaluate setup quality rather than entry noise
- Limit yourself to three charts and document your bias before each session to maintain focus and prevent chart overload
For traders looking to explore advanced scalping strategy types, integrating these methods with a disciplined multi-timeframe framework is where the real edge compounds.
How does Quantlogicx support multi-timeframe scalping?
Quantlogicx built its TradingView indicator specifically around the problems that multi-timeframe scalpers face: signal reliability, execution timing, and decision fatigue. The tool operates across stocks, forex, and cryptocurrency, delivering long and short signals that are locked at bar close using zero repaint technology. That matters because a signal that changes after the fact isn't a signal; it's noise with a timestamp.
The indicator reflects strong performance across its user base, with individual users reporting significant gains in some months. Those figures come from Quantlogicx's own reported data and reflect the kind of outcomes that disciplined multi-timeframe application can produce when the signal layer is reliable.
Where Quantlogicx specifically reduces friction in multi-timeframe scalping is in the execution phase. Real-time alerts mean you're not staring at the 1-minute chart waiting for a trigger; the indicator flags it for you. That alone addresses one of the biggest behavioral problems in scalping: the over-monitoring of the execution chart that leads to emotional exits.
The platform also supports a community of traders sharing setups and outcomes, which accelerates pattern recognition for newer scalpers who haven't yet built the instinct for reading multi-timeframe confluence. For experienced traders, the signal filtering reduces the number of marginal setups that would otherwise tempt a trade.
Pro Tip: Use Quantlogicx's real-time alerts as your execution chart trigger, then validate the signal against your 5-minute and 1-hour charts before entering. The alert handles the timing; your multi-timeframe framework handles the context.
Scalping success depends not just on rapid trade execution but on patient selection of confluences across timeframes. The traders who win consistently aren't the ones watching every tick; they're the ones who wait for the setup where everything lines up.
Quantlogicx: your edge in multi-timeframe scalping
Most scalpers spend months building a reliable signal layer from scratch, testing indicators, dealing with repaint issues, and losing money on setups that looked valid in hindsight but weren't in real time. Quantlogicx cuts that process significantly.
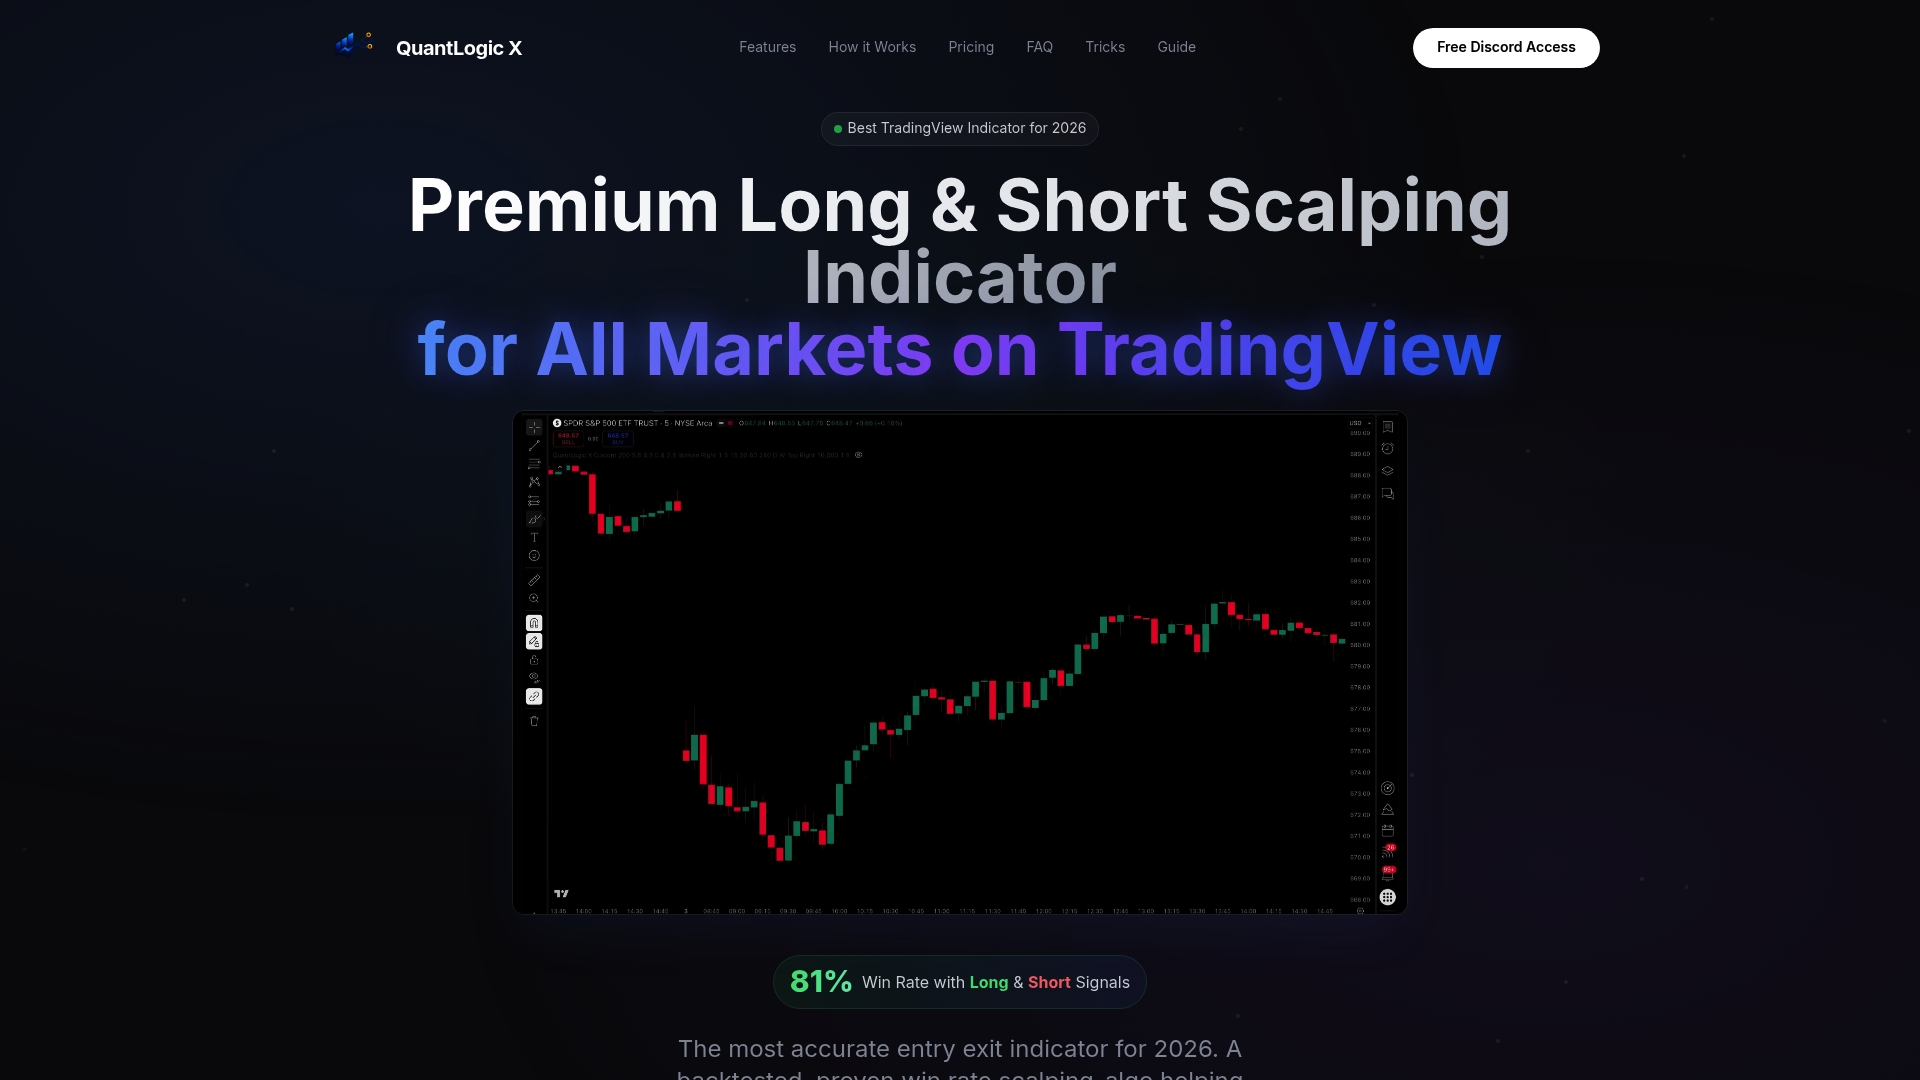
The best buy-sell indicator for TradingView in 2026 is built for exactly the workflow this guide describes: set your bias on the higher timeframe, let Quantlogicx flag the execution trigger on the lower timeframe, and manage the trade using the signal timeframe's structure. Zero repaint means the signal you acted on is the signal that stays in your chart history. Over 2,000 traders across stocks, forex, and crypto are already using it. If you're ready to add a reliable signal layer to your multi-timeframe stack, explore Quantlogicx and see the indicator in action.
Key Takeaways
Multi-timeframe scalping strategy works because it forces directional alignment across three chart levels before any capital is committed, filtering out the noise that kills single-chart scalpers.
| Point | Details |
|---|---|
| Three-chart structure | Use a context chart for trend, a setup chart for patterns, and an execution chart strictly for entry triggers. |
| 4–6x spacing rule | Each timeframe should be 4–6 times larger than the one below it to avoid redundant signals. |
| Higher timeframe authority | The highest timeframe always sets directional bias; lower timeframe signals that contradict it are skipped. |
| Stop placement discipline | Place stops at the signal timeframe's structural level, not the execution chart's noise, to avoid premature exits. |
| Quantlogicx signal layer | Quantlogicx's zero repaint TradingView indicator locks signals at bar close, supporting reliable multi-timeframe execution across stocks, forex, and crypto. |
FAQ
What timeframes work best for scalping?
The most effective scalping stack is 30-minute for trend context, 5-minute for setup identification, and 1-minute for entry execution. Each timeframe should be 4–6 times larger than the one below it to ensure each chart adds genuinely distinct information.
What do you do when timeframes conflict?
When higher and lower timeframes point in opposite directions, the correct move is to wait for alignment rather than force a trade. The higher timeframe always holds authority; a bearish 15-minute overrules a bullish 1-minute signal every time.
How do EMA and VWAP fit into multi-timeframe scalping?
A 9-period EMA crossing above a 21-period EMA on the 5-minute chart signals a bullish entry cue, but only when the 1-hour EMA trend confirms the same direction. VWAP adds a session-level fair value anchor; pullbacks to VWAP in a confirmed uptrend are among the highest-probability scalp entry zones.
How does Quantlogicx help with multi-timeframe scalping?
Quantlogicx's TradingView indicator uses zero repaint technology to lock signals at bar close, eliminating the false historical signals that distort win rate tracking. Real-time alerts handle execution timing so traders can focus on higher timeframe context rather than staring at the 1-minute chart.
What is the biggest mistake in multi-timeframe scalping?
Trading a lower timeframe signal against the higher timeframe trend is the single most expensive error. Even when the 1-minute setup looks textbook-clean, entering against the 15-minute or 1-hour trend puts you on the wrong side of the dominant market force.