

Technical analysis is the primary toolkit day traders use to identify intraday opportunities and make rapid decisions based on price and volume behavior. It does not predict the future. What it does is structure your thinking around probabilities, giving you a repeatable framework to assess whether a setup favors buyers or sellers right now. For day traders who need quick interpretation of real-time data streams, that structure is the difference between reacting on instinct and executing on evidence.
Here is the core of what technical analysis does in day trading:
- Reads price and volume data to gauge market sentiment and momentum without requiring fundamental research
- Offers probability-based setups, not guarantees, where odds slightly favor one direction
- Enables near-instant assessment through charts, indicators, and patterns
- Guides trade timing, entry precision, and stop placement in fast-moving markets
- Supports risk management by defining where a setup is invalidated before you click buy
Table of Contents
- How technical analysis shapes your day trading decisions
- Key indicators and chart types every day trader should know
- What technical analysis actually assumes about markets
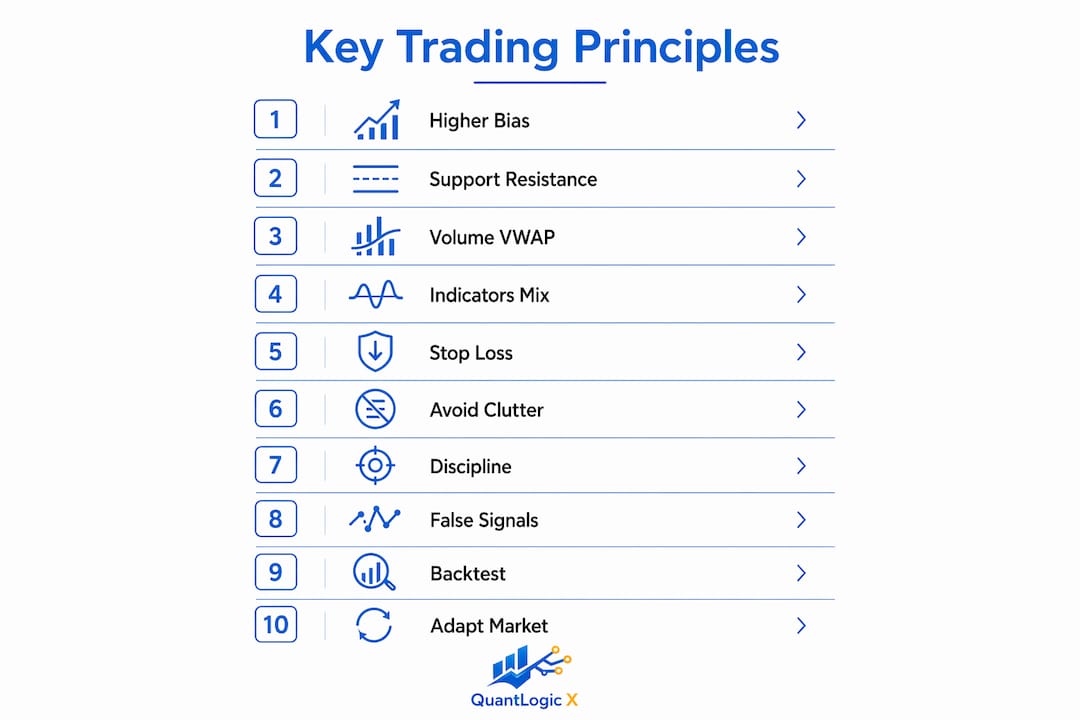
- 10 practical lessons for applying technical analysis in day trading
- Where technical analysis falls short in day trading
- The research-backed case for technical analysis as a probability framework
- Key Takeaways
- FAQ
How technical analysis shapes your day trading decisions
The role of technical analysis in day trading is not to tell you what a stock will do. It is to tell you what the chart says is more likely. A stock sitting at a well-tested support level with rising volume and a bullish MACD crossover has better odds of bouncing than one in freefall with no buyers visible. Technical analysis quantifies that edge and helps you size your risk around it.
Day traders do not have six months to wait for an earnings thesis to play out, which is why platforms incorporating features from the TradeApp case study enable systematic trade management and discipline guidance. You need to know right now whether a stock holds $182 or breaks to $178. That urgency is why technical analysis, not fundamental research, dominates intraday decision-making. It systematizes trading decisions, moving you away from reactive, gut-driven actions toward rules-based execution.
Key indicators and chart types every day trader should know
Technical analysis summarizes price and volume data through charts and indicators, letting you interpret market behavior without digging into balance sheets. Candlestick charts are the foundation. Each candle shows open, high, low, and close, making it easy to spot rejection candles, engulfing patterns, and continuation signals at a glance.
Beyond candlesticks, the most useful indicators for day trading are:
- VWAP (Volume Weighted Average Price): Resets daily and acts as a key intraday benchmark because institutional desks use it to measure execution quality. Price above VWAP generally means buyers control the session.
- 9 and 20 EMA: Short-term exponential moving averages that define intraday trend direction and act as dynamic support or resistance.
- RSI: Oscillates between 0 and 100. Readings above 70 signal overbought conditions; below 30 signals oversold. Divergence between RSI and price is one of the more reliable reversal signals.
- MACD: Tracks two EMAs (typically the 12 and 26). A bullish crossover confirms momentum, but use it as confirmation of price action, not as a standalone trigger.
- Volume: The most important indicator of all. A price move with high volume has conviction. The same move on thin volume is suspect.
Overloading charts with too many indicators leads to conflicting signals and confusion. Most experienced day traders settle on two or three indicators they understand deeply. That is it. If you have MACD, RSI, Stochastic, Bollinger Bands, three moving averages, and VWAP running simultaneously, you will get conflicting signals constantly. Clarity beats completeness every time.
Pro Tip: Build your chart around one trend indicator, one momentum indicator, and volume. That combination covers direction, strength, and conviction without cluttering your screen.
For traders who want a deeper look at how indicators work together, the trading indicator basics guide from Quantlogicx breaks down the mechanics clearly.

What technical analysis actually assumes about markets
Three core assumptions underpin every chart pattern and indicator signal you will ever use. Understanding them helps you know when technical analysis is likely to work and when it is not.
- Price reflects everything. Earnings, news, sentiment, institutional flow, retail momentum. All of it gets priced in. So instead of researching every company's financials, you study price behavior directly.
- Markets move in trends. Prices do not move randomly. They flow in identifiable directions over time, and the goal is to identify the prevailing trend early and trade with it until evidence of a reversal appears.
- History repeats itself. Trader memory creates support and resistance. If a stock bounced hard off $240 twice last week, traders are watching $240 again. That collective attention creates a floor. Chart patterns like double tops and bull flags recur because human psychology under pressure is consistent.
- Technical analysis measures probabilities, not certainties. No indicator or pattern guarantees an outcome. The framework gives you setups where odds favor one direction, not a promise.
- Day trading assumes continuous liquidity. Rapid entries and exits only work in markets with enough volume to absorb your orders without moving price against you.
10 practical lessons for applying technical analysis in day trading
1. Start with a higher timeframe bias
Successful intraday traders use multi-timeframe analysis from higher to lower timeframes to establish directional bias before touching an execution chart. Check the daily chart first. Write down the bias in plain language: "Daily is bullish, looking for longs from the 4H discount zone near $X." Then drop to your 5-minute chart for entry. Without that context, even a perfect-looking lower-timeframe setup has a coin-flip chance of working.
2. Identify and respect key support and resistance levels
Support and resistance are where the real decisions happen. Mark prior intraday highs and lows, pivot points, and VWAP. These are the levels where institutional orders cluster and where price is most likely to react. Trading at random prices between levels is where most retail traders bleed money.
3. Use volume and VWAP as confirmation tools
Volume confirms price. A breakout above resistance on heavy volume is a signal worth taking. The same breakout on thin volume is a trap waiting to close. VWAP gives you the intraday value area. Trades above VWAP in an uptrend and below VWAP in a downtrend align you with institutional flow.
4. Combine leading and lagging indicators
Leading indicators like RSI and stochastic attempt to signal reversals before they happen. Lagging indicators like moving averages and MACD confirm trends already underway. Use lagging indicators for trend direction and leading indicators for entry timing within that trend. Neither works well in isolation.

5. Define your stop loss before you enter
Risk management is not optional. Before you click buy, know exactly where the setup is invalidated and place your stop there. Position size follows from that stop distance and your maximum risk per trade. This sequence, stop first, then size, is what separates disciplined traders from gamblers. The day trading risk management guide from Quantlogicx covers this workflow in detail.
6. Avoid indicator clutter and look for confluence
Overloading charts with too many indicators reduces effectiveness. Two or three non-correlated indicators pointing to the same conclusion is confluence. That is a high-probability setup. Five indicators pointing in five directions is noise. Understanding trade signal confluence is one of the fastest ways to filter quality setups from marginal ones.
7. Maintain discipline against emotional trading
A common misconception is that technical analysis is a get-rich-quick method. Its primary value is systematizing decision-making to enable consistent, objective execution. Fear and greed will push you to chase moves and hold losers. A rules-based approach built on technical signals gives you a reason to act or stay flat that has nothing to do with how you feel.
8. Plan for false signals and whipsaws
In choppy markets, a large portion of technical signals can result in whipsaws, where traders are repeatedly stopped out before a trend develops. False signals are not failures of the system. They are a built-in cost of doing business. Plan for them by keeping your risk per trade small enough that a string of whipsaws does not wipe out your account.
9. Backtest before risking real capital
Paper trading lets you test your strategy in real market conditions without financial exposure. Run your technical setups through a simulator across different market conditions before committing real money. What looks good in hindsight often performs differently in live markets, especially after costs.
10. Adapt to prevailing market conditions
Pro Tip: Technical analysis tools perform differently depending on whether the market is trending or ranging. Moving average crossovers shine in trends and fail in choppy sideways conditions. Adjust your approach to match the environment, not the other way around.
Where technical analysis falls short in day trading
Technical analysis has real limits, and ignoring them is expensive. Here is where it breaks down:
- No predictive certainty. Standard intraday technical trading rules struggle to outperform benchmarks once costs and data biases are accounted for. Probabilities do not guarantee outcomes.
- Choppy markets generate false signals. In sideways conditions, many technical signals result in whipsaws, repeatedly stopping traders out before any trend develops.
- Transaction costs erode small edges. Technical methods' edges weaken significantly after costs, turning paper profits into marginal or negative real returns. Frequent trading amplifies this problem.
- Data mining creates misleading patterns. The more variables you test on historical data, the more likely you are to find patterns that do not hold in live markets. Overfitting is a silent killer of backtested strategies.
- Over-reliance on indicators distracts from price action. Indicators are derived from price. Price action itself is the primary signal. Traders who trust their indicator more than the chart often miss what is actually happening.
- Emotional biases amplify losses. Even a sound technical framework fails when traders override their rules. Poor risk management and emotional decision-making erase whatever edge the analysis provides.
The research-backed case for technical analysis as a probability framework
Technical analysis works best when you treat it as a tool for quantifying edge, not predicting markets. Most technical signals generate win rates around 50–55% before trading costs. That is a thin margin. Proper risk management is what transforms a small statistical edge into consistent profitability over time.
The academic picture is mixed but not dismissive. A review covering 92 modern studies found that 63% reported positive results from technical trading strategies. The caveat is that many of those edges weakened once tested out of sample or adjusted for transaction costs. The takeaway is not that technical analysis does not work. It is that it needs context, discipline, and ongoing validation.
Pro Tip: Treat every technical signal as a hypothesis to test, not a promise to act on. The traders who succeed long-term are the ones who continuously validate their setups and adapt when conditions shift.
Technical analysis edges tend to be small and fragile. Poor execution or emotional trading can erase them quickly. The traders who extract consistent value from charts are the ones who pair their analysis with strict risk controls and a disciplined routine. For a practical look at building that routine, the day trading consistency guide from Quantlogicx is worth reading.
| Factor | Impact on Technical Analysis Edge |
|---|---|
| Win rate before costs | Typically 50–55% for common strategies |
| Transaction costs | Often reduce edge to near breakeven |
| Choppy market conditions | Whipsaws can affect a substantial portion of signals |
| Disciplined risk management | Converts small edge into net profitability |
| Confluence of signals | Filters high-probability setups from noise |
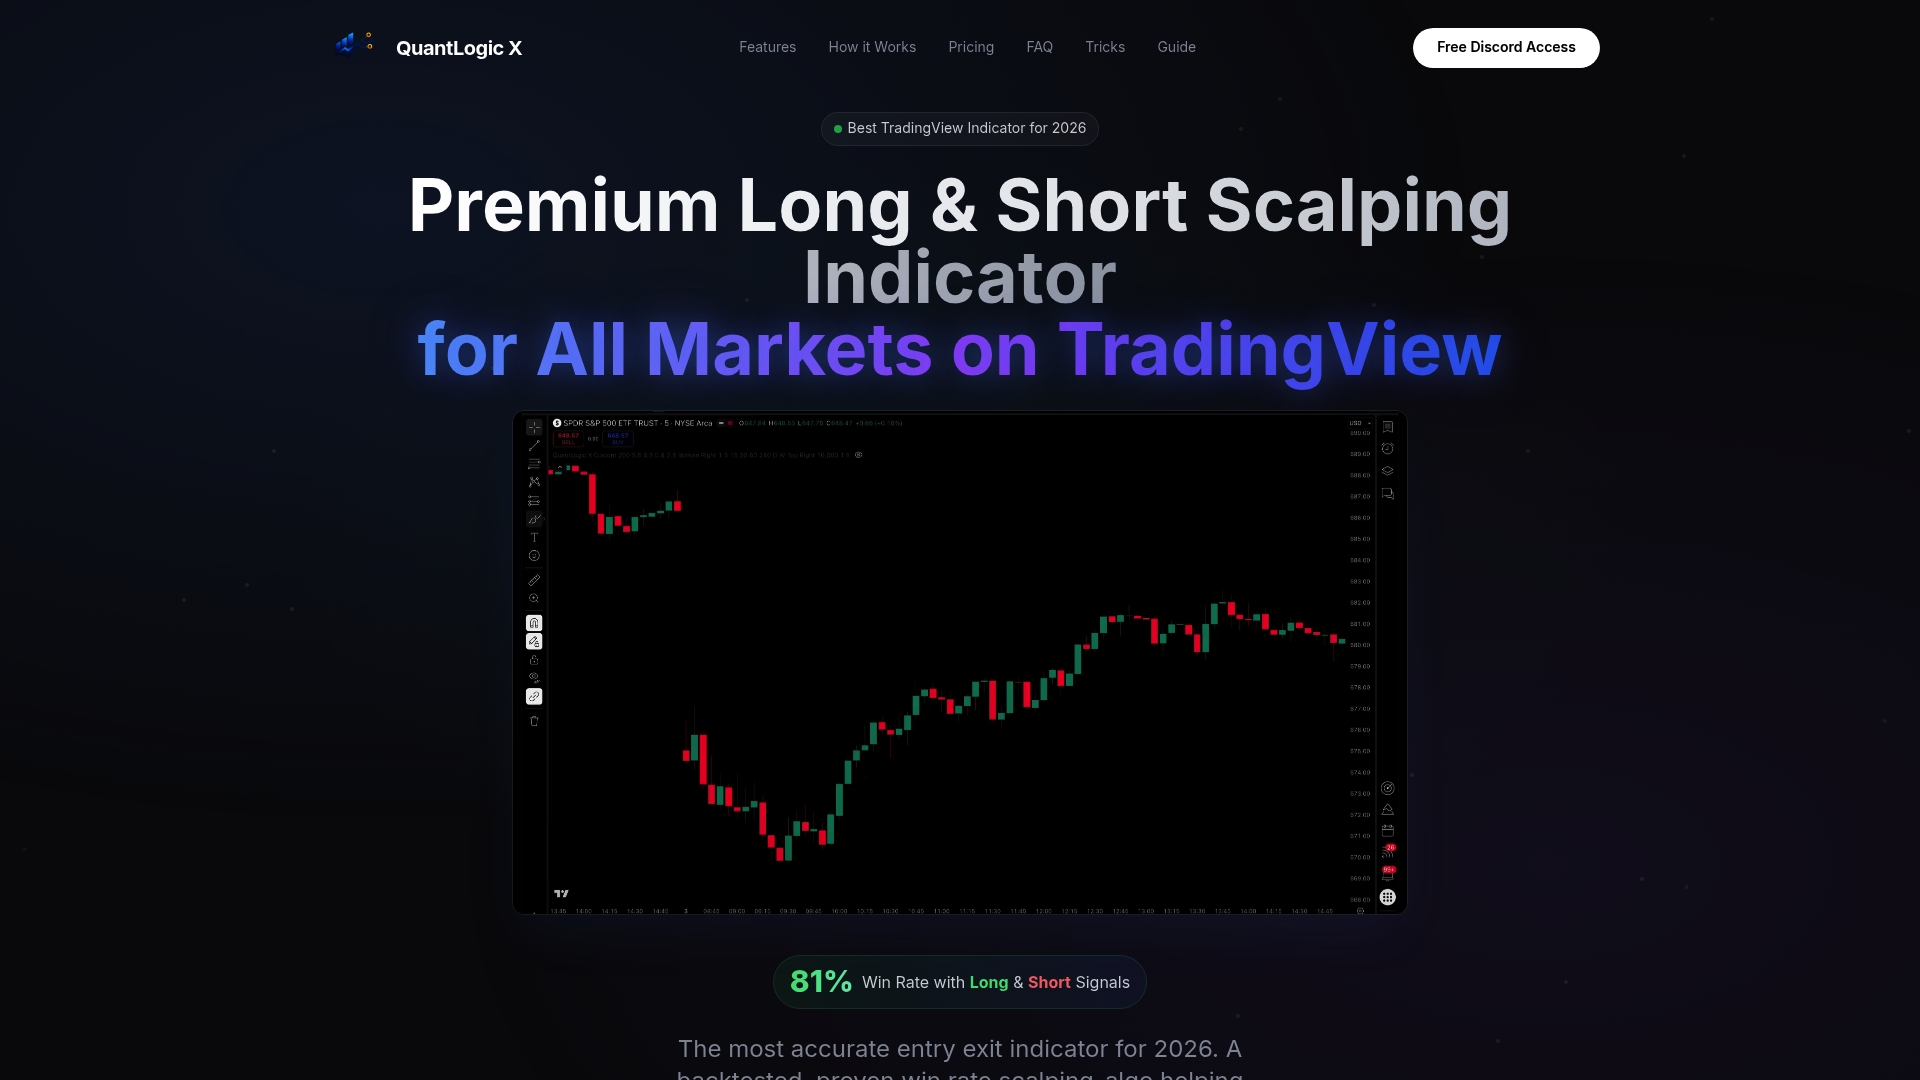
Quantlogicx addresses the speed and confluence problem directly. Its TradingView indicator uses zero repaint technology to deliver long and short signals that are reliable at bar closure, with an 81% win rate in scalping across stocks, forex, and cryptocurrency. Over 2,000 traders use it to cut through the noise that manual chart reading generates under time pressure.
If you trade forex, the Quantlogicx forex signals indicator is built specifically for scalping intraday setups with minimal lag. For crypto traders, the crypto-focused scalping indicator applies the same confluence logic to digital asset markets.
Key Takeaways
Technical analysis gives day traders a probability-based framework for identifying setups, but its edge is small and requires strict risk management and disciplined execution to be profitable.
| Point | Details |
|---|---|
| Win rates are thin | Most technical strategies produce win rates slightly above 50% before costs, making execution quality critical. |
| Costs erode edges | Transaction costs and slippage frequently reduce technical edges to near breakeven in live markets. |
| Confluence filters noise | Combining two or three non-correlated indicators pointing to the same conclusion improves setup quality. |
| Higher timeframe bias matters | Starting analysis on the daily chart before dropping to execution timeframes reduces false entries. |
| Risk management converts edge | Defining stop losses and position size before entry is what turns a small statistical edge into net gains. |
FAQ
Does technical analysis actually work for day trading?
Technical analysis can work for day trading when applied with discipline, proper risk management, and realistic expectations. Research shows that its edge is real in certain conditions but narrows significantly after transaction costs and out-of-sample testing.
What does technical analysis do in trading?
Technical analysis reads price and volume data to identify patterns, trends, support and resistance levels, and momentum signals. It provides a structured, probability-based framework for deciding when and where to enter or exit a trade.
What is the 3-5-7 rule in day trading?
The 3-5-7 rule is a risk management guideline where traders risk no more than 3% on any single trade, keep total open risk below 5% of their account, and target a minimum 7% reward on winning trades to maintain a positive risk-reward ratio over time.
How much can a day trader with a $100,000 account make per day on average?
Daily returns vary widely based on strategy, market conditions, and skill level. Given that most technical strategies produce win rates of 50–55% before costs, consistent daily profits depend far more on risk management and execution quality than on account size alone.
Which technical indicators work best for day trading?
VWAP, the 9 and 20 EMA, RSI, MACD, and volume are the most widely used indicators for intraday trading. Most experienced traders limit themselves to two or three of these to avoid conflicting signals and maintain chart clarity.